We recently reached out to our users with Chronic Pain to ask them how they use Bearable. The advice in this article is adapted from their recommendations as well as some useful tips of our own.
One Bearable user “wanted to keep track of chronic pain and its cycles and figure out if it correlated with activities.”
They recommended that “If you’re tracking pain, don’t downplay it. Create categories for specific areas of the body and be consistent in how you track intensity.”
🤔 How to think about tracking pain in Bearable?
One user recommends starting by keeping track of all of your symptoms so that you can determine which ones are most significant to you.
“Being able to see what other symptoms come and go vs what stays consistent helps weed out what is more significant.”
Taking this approach will allow you to focus on tracking what’s most important to you, as well as reducing the number of symptoms you need to track over time.
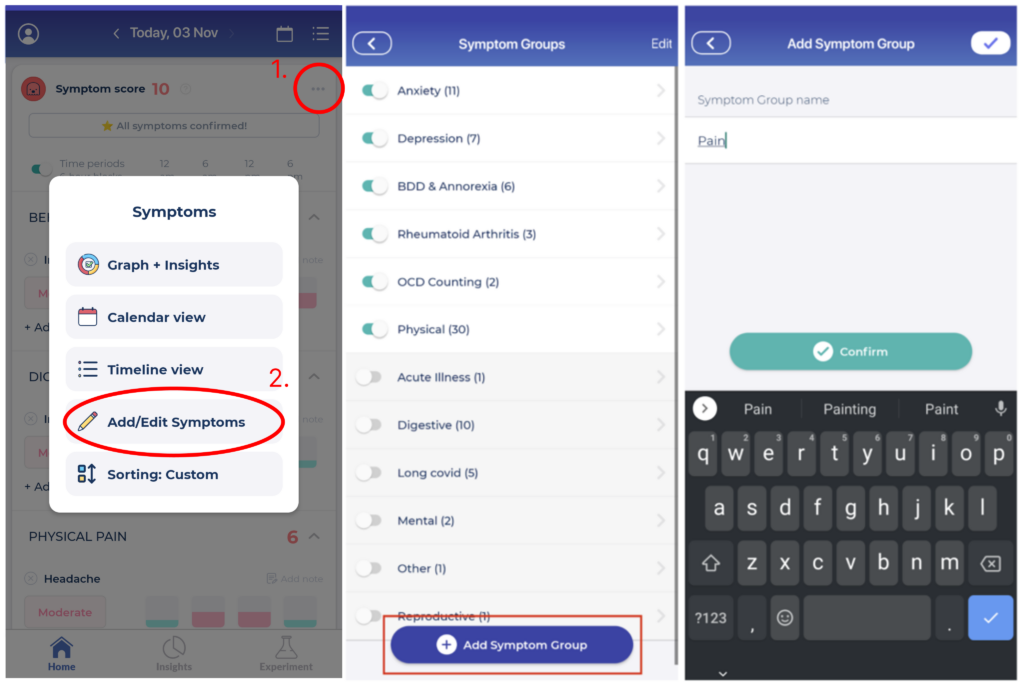
🏗️ How do you create Symptom Groups for Pain in Bearable?
-
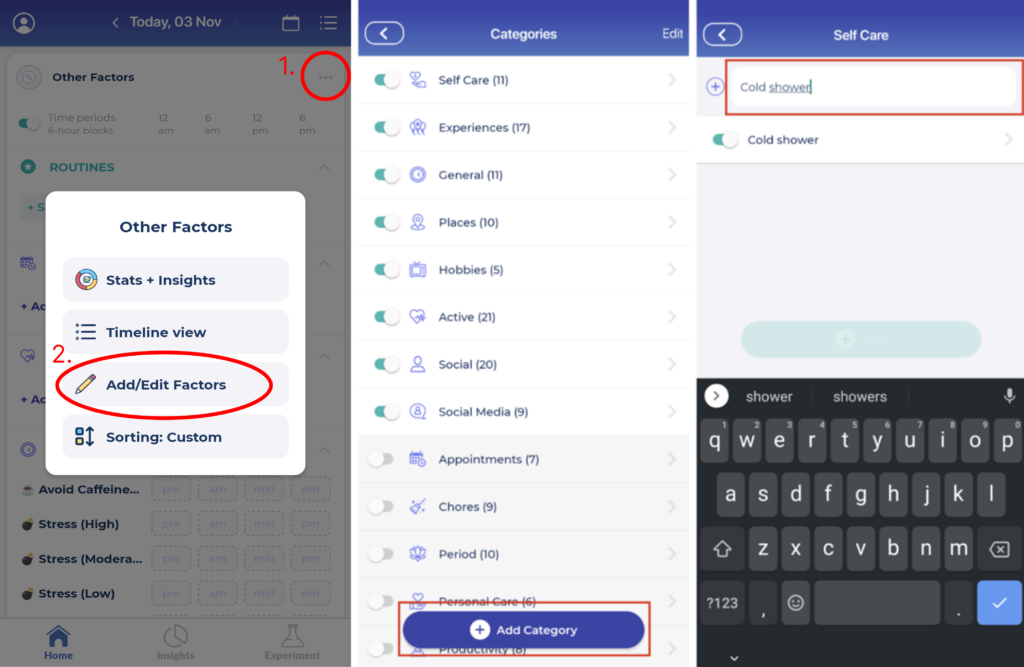
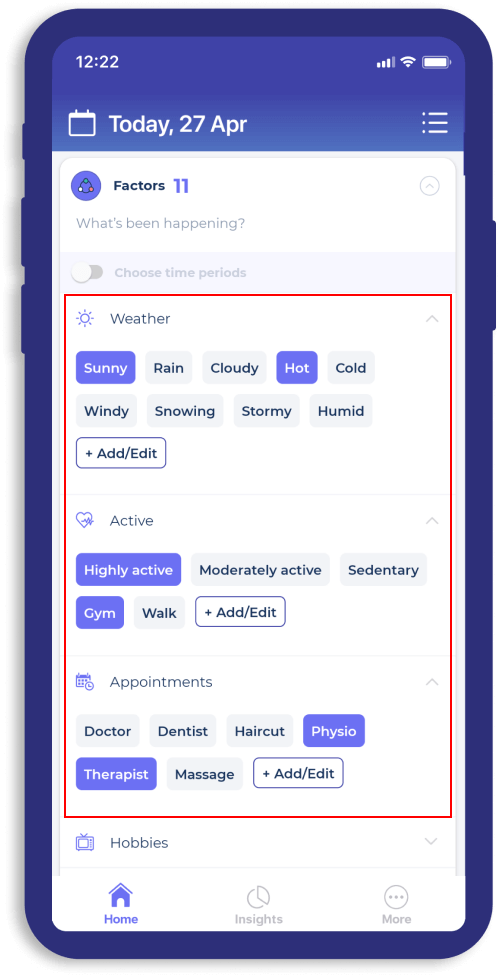
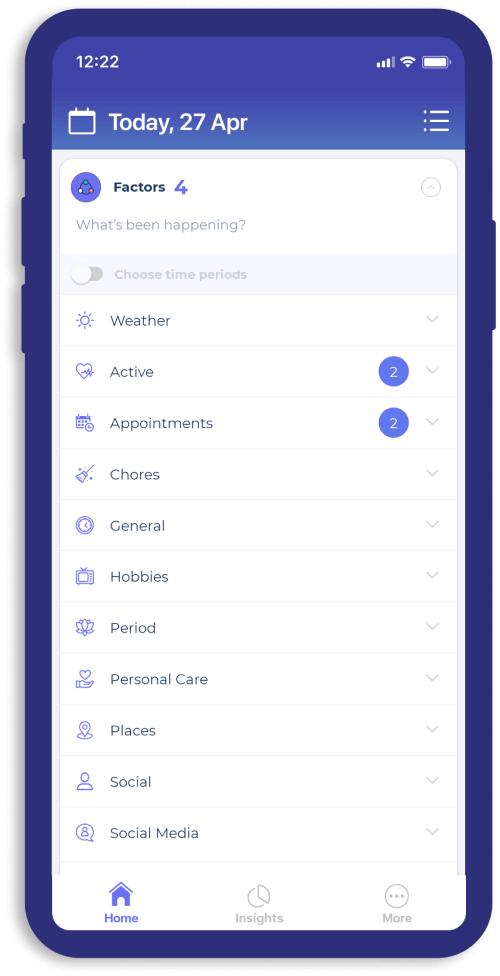
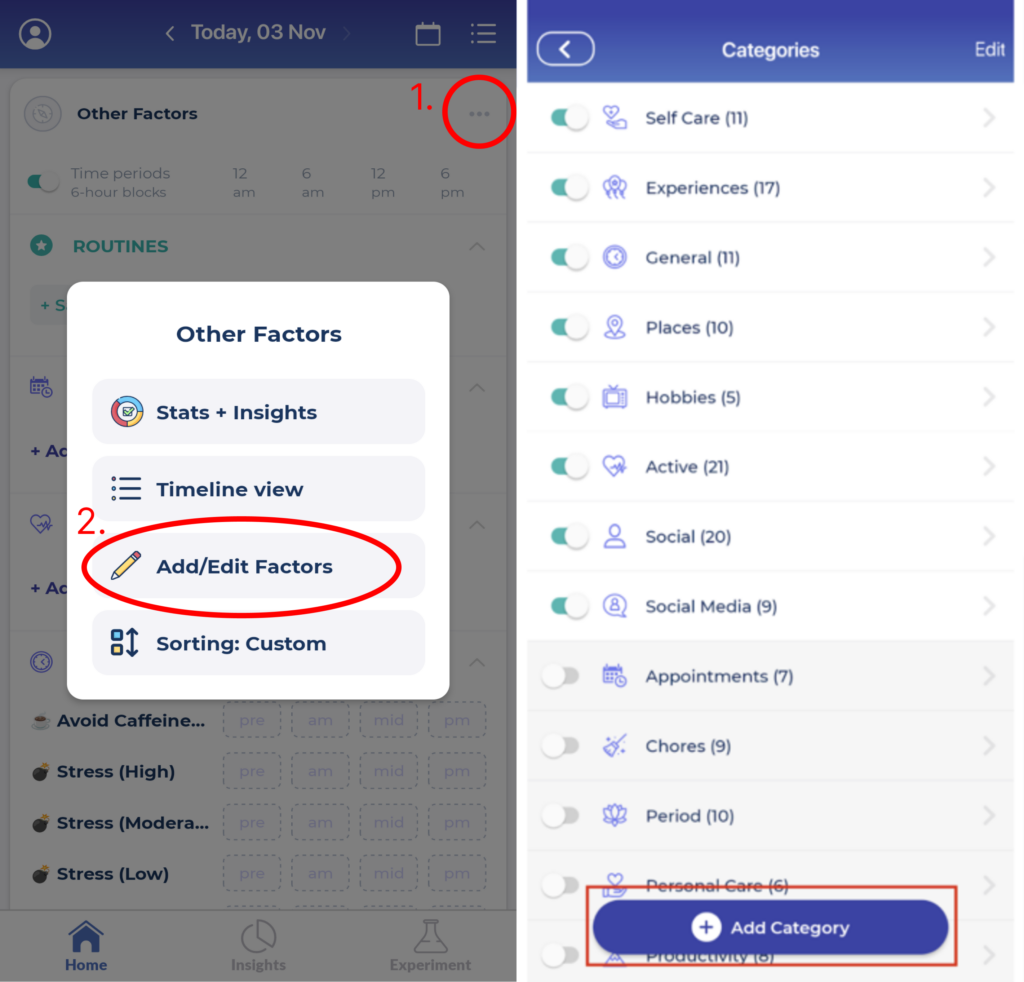
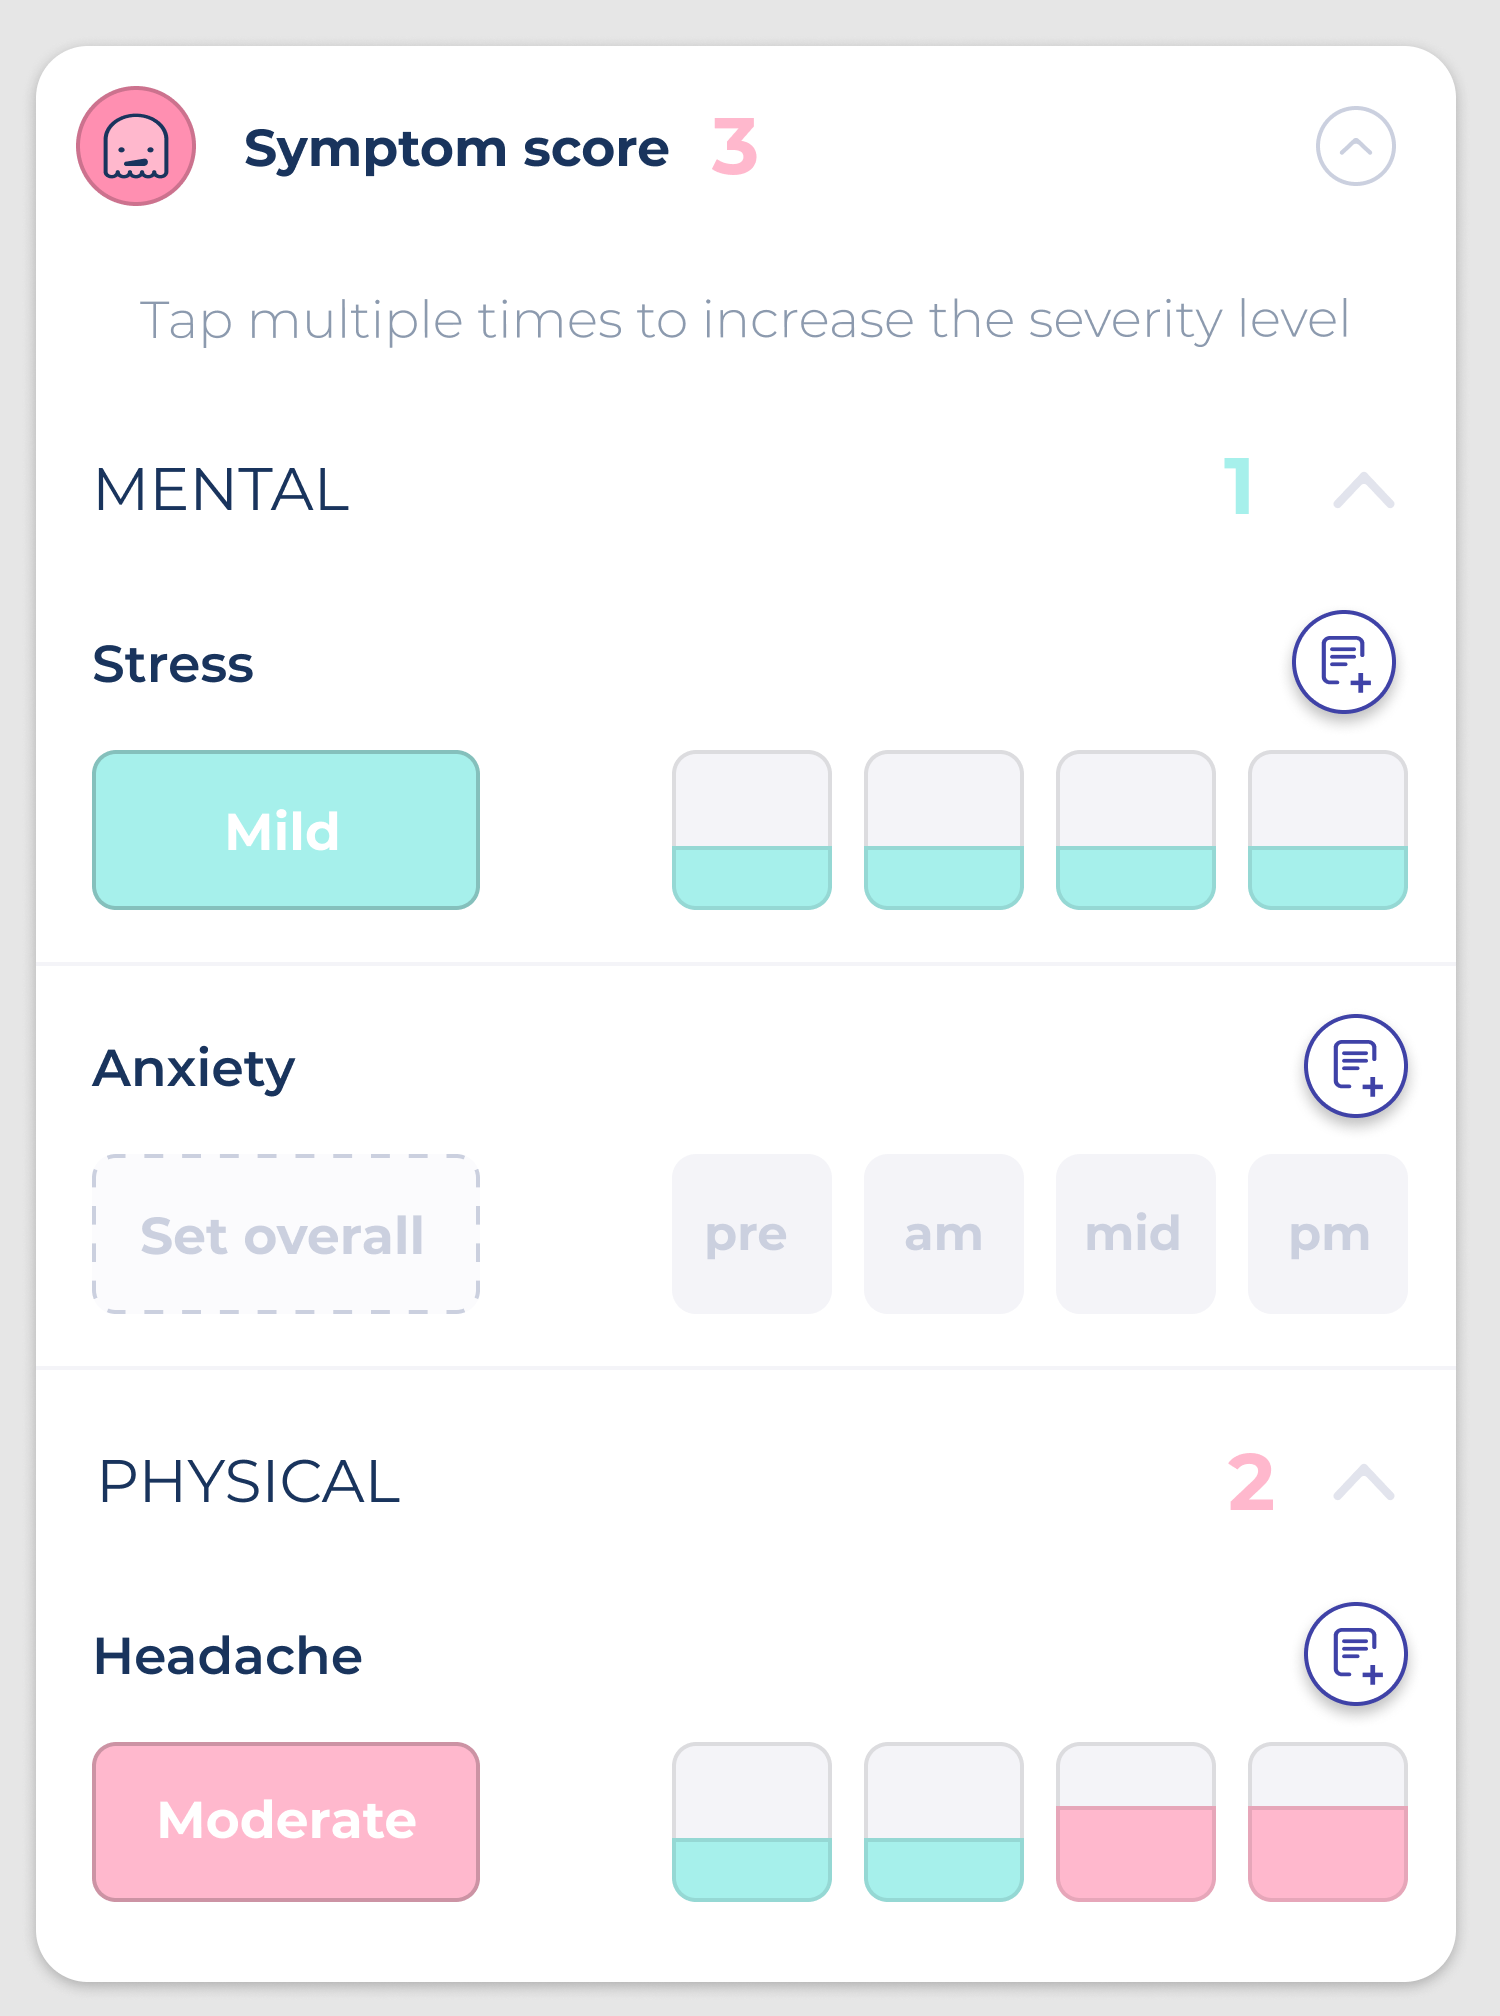
- Open the Symptoms section on your home screen
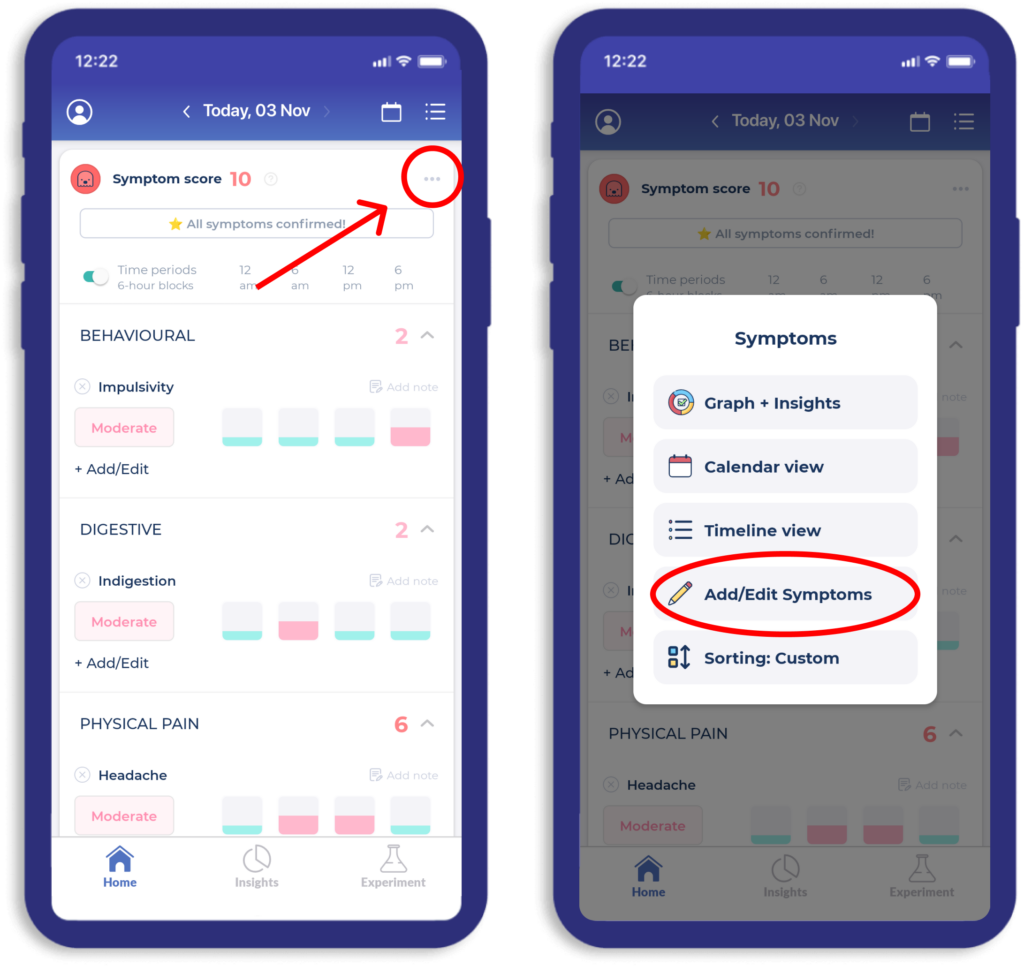
- Click the ‘add/edit’ button in the menu in the top right corner.
- On the next screen click the button “Add Symptom Group”
- Name the group Pain or Chronic Pain
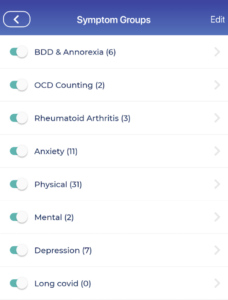
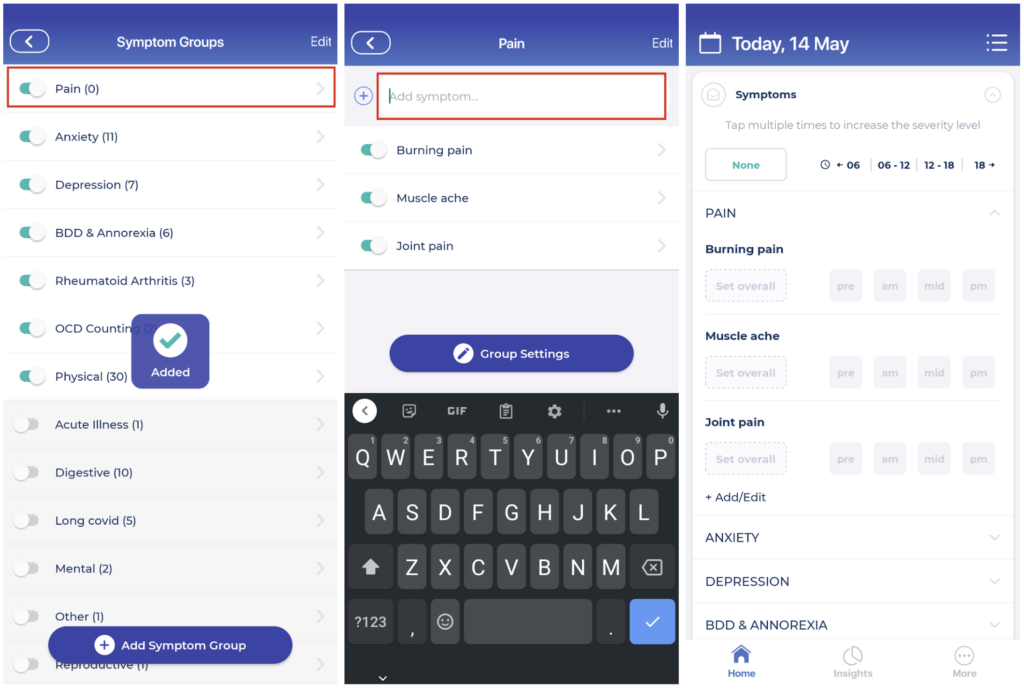
- This Symptom Group will now appear at the top of your list of Symptom Groups
- Click into your new Symptom Group to begin adding Symptoms
If you want to track your pain at a more granular level, you might decide to track different types of pain and different places where pain occurs in your body. There are two ways you can configure your Symptom Groups to do this:
-
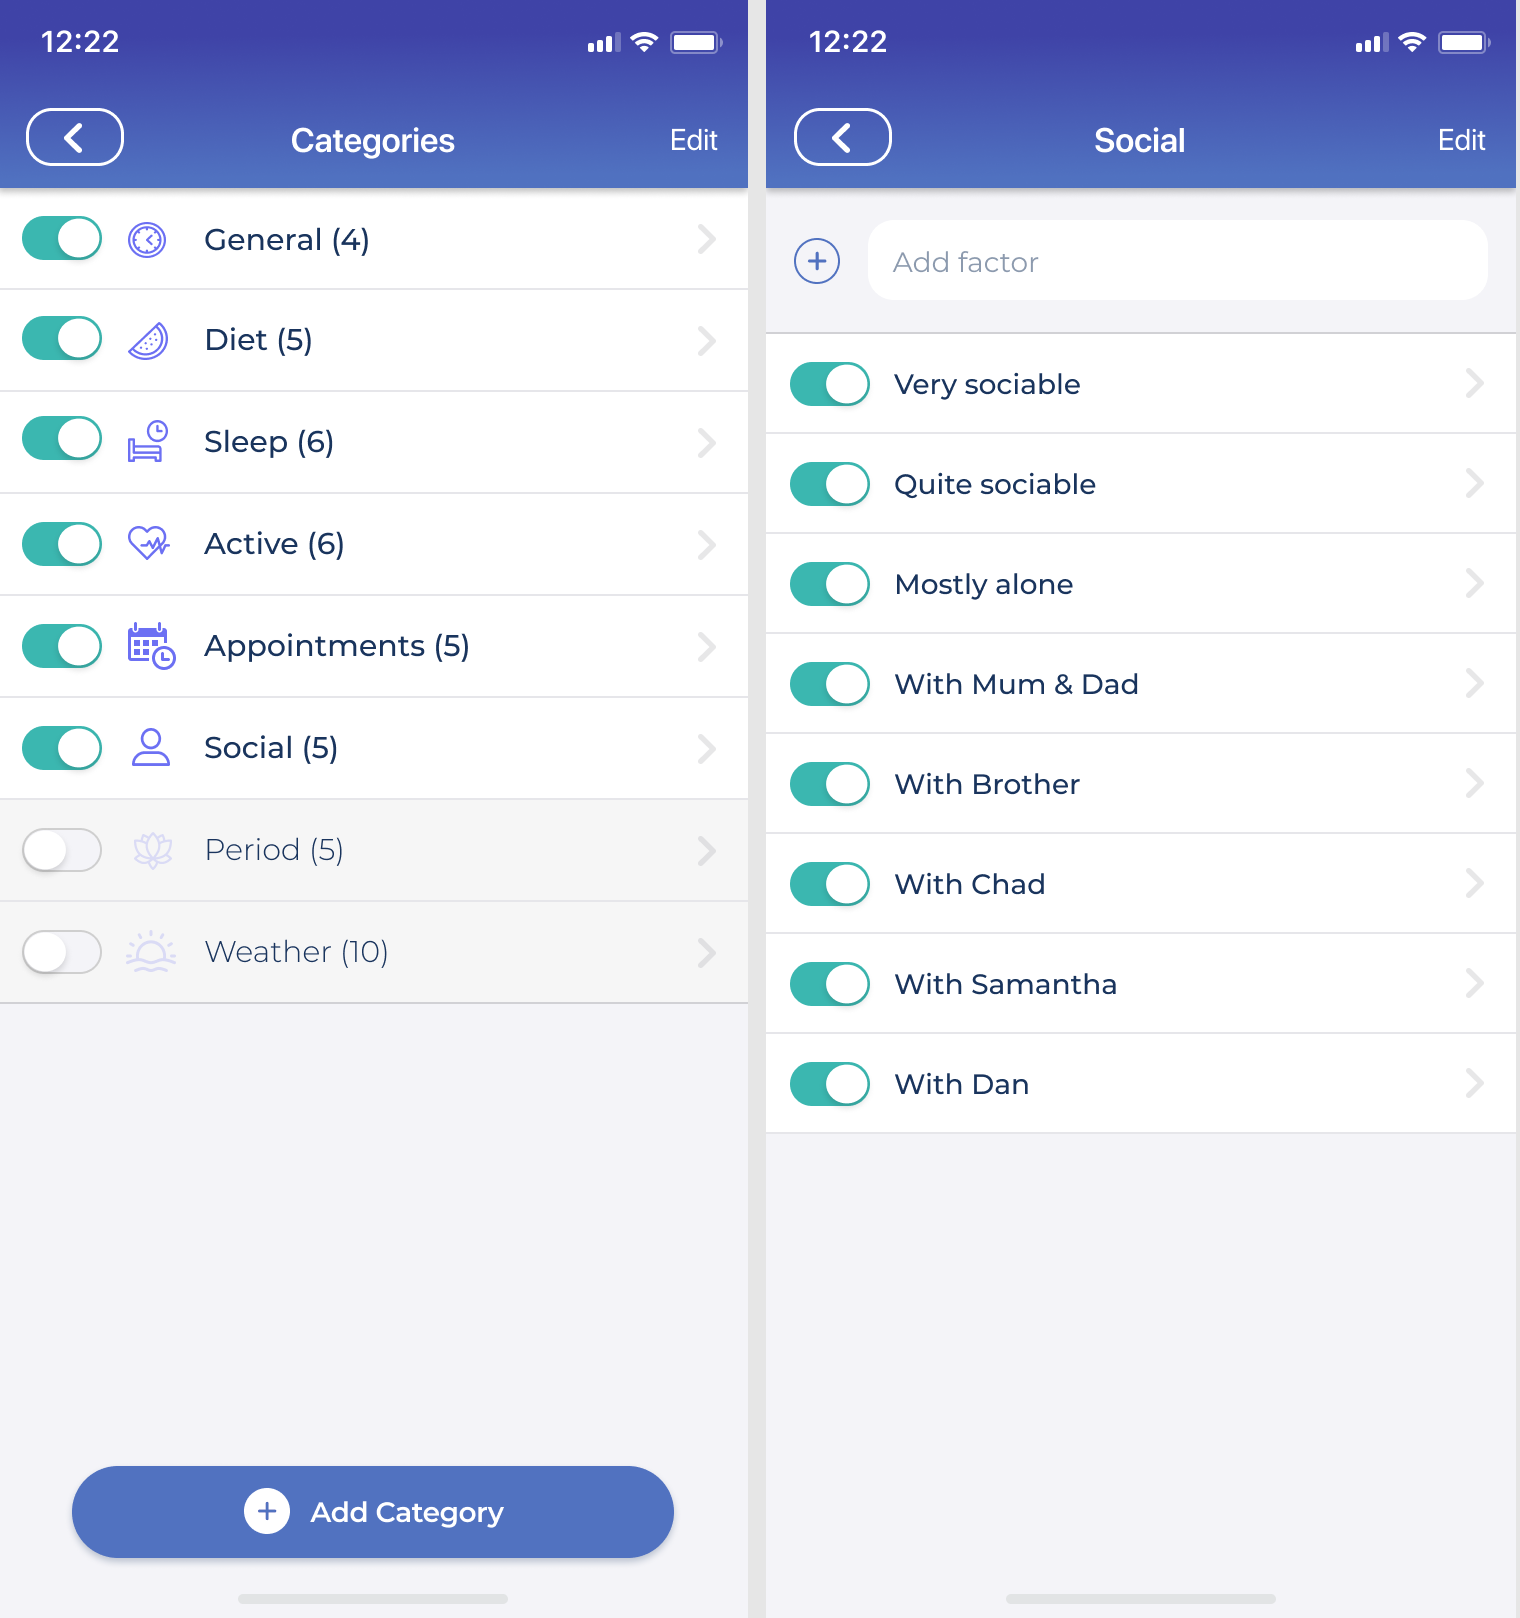
- Create symptom groups for each part of your body e.g. “Back pain” and add types of pain as symptoms to this e.g. “muscle ache”.
- Create symptom groups for each type of pain e.g. “Burning Pain” and symptoms for each part of the body e.g. “shoulders”.
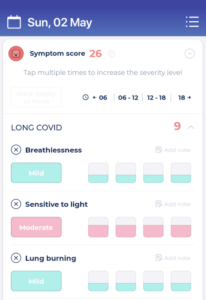
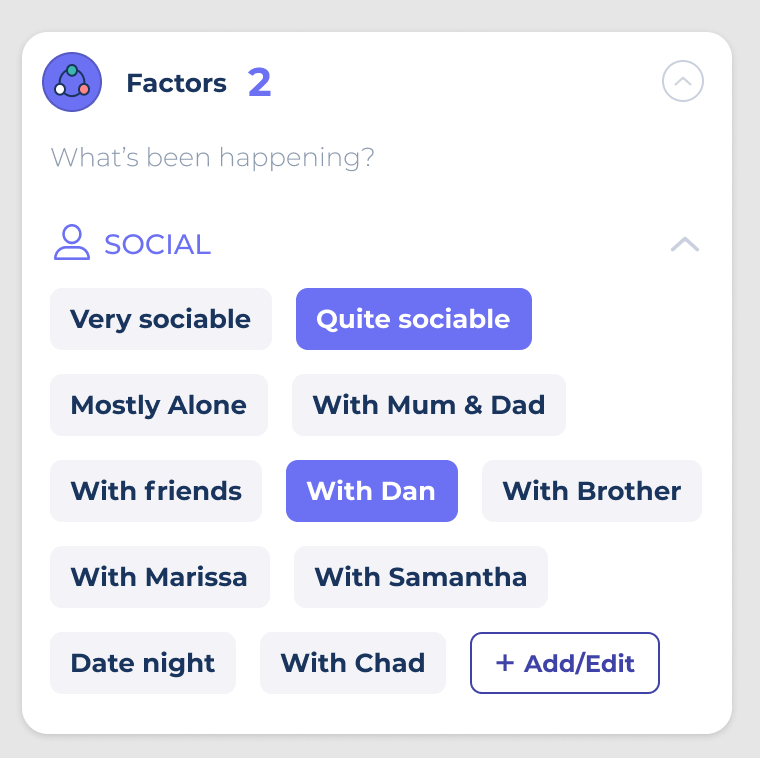
However you configure your symptom groups and symptoms, they’ll appear at the top of your Symptoms section on your home screen.
😨 What if you feel overwhelmed by tracking pain in Bearable?
“When finding a shiny new app, it can be tempting to create a gazillion custom factors or metrics and then enthusiastically fill them out for a few days until the long list becomes daunting”
It’s common that new Bearable users can feel overwhelmed by the amount that they can track at first. Our users often recommend tracking fewer things to begin with to help you build the habit of using the app. For users with chronic pain, this could be:
-
- Tracking just the types and severity of pain BUT not the location on their body
- Track the severity and location of pain BUT not the type of pain
- Just tracking the severity of pain BUT not the type or location
You could also track your Pain at a granular level but choose to track a smaller number of factors. Some users recommend focusing on just the factors that you think are having the biggest impact on your health. When taking any of these approaches you will still be able to look for correlations between your pain and your Factors in the Insights tab.
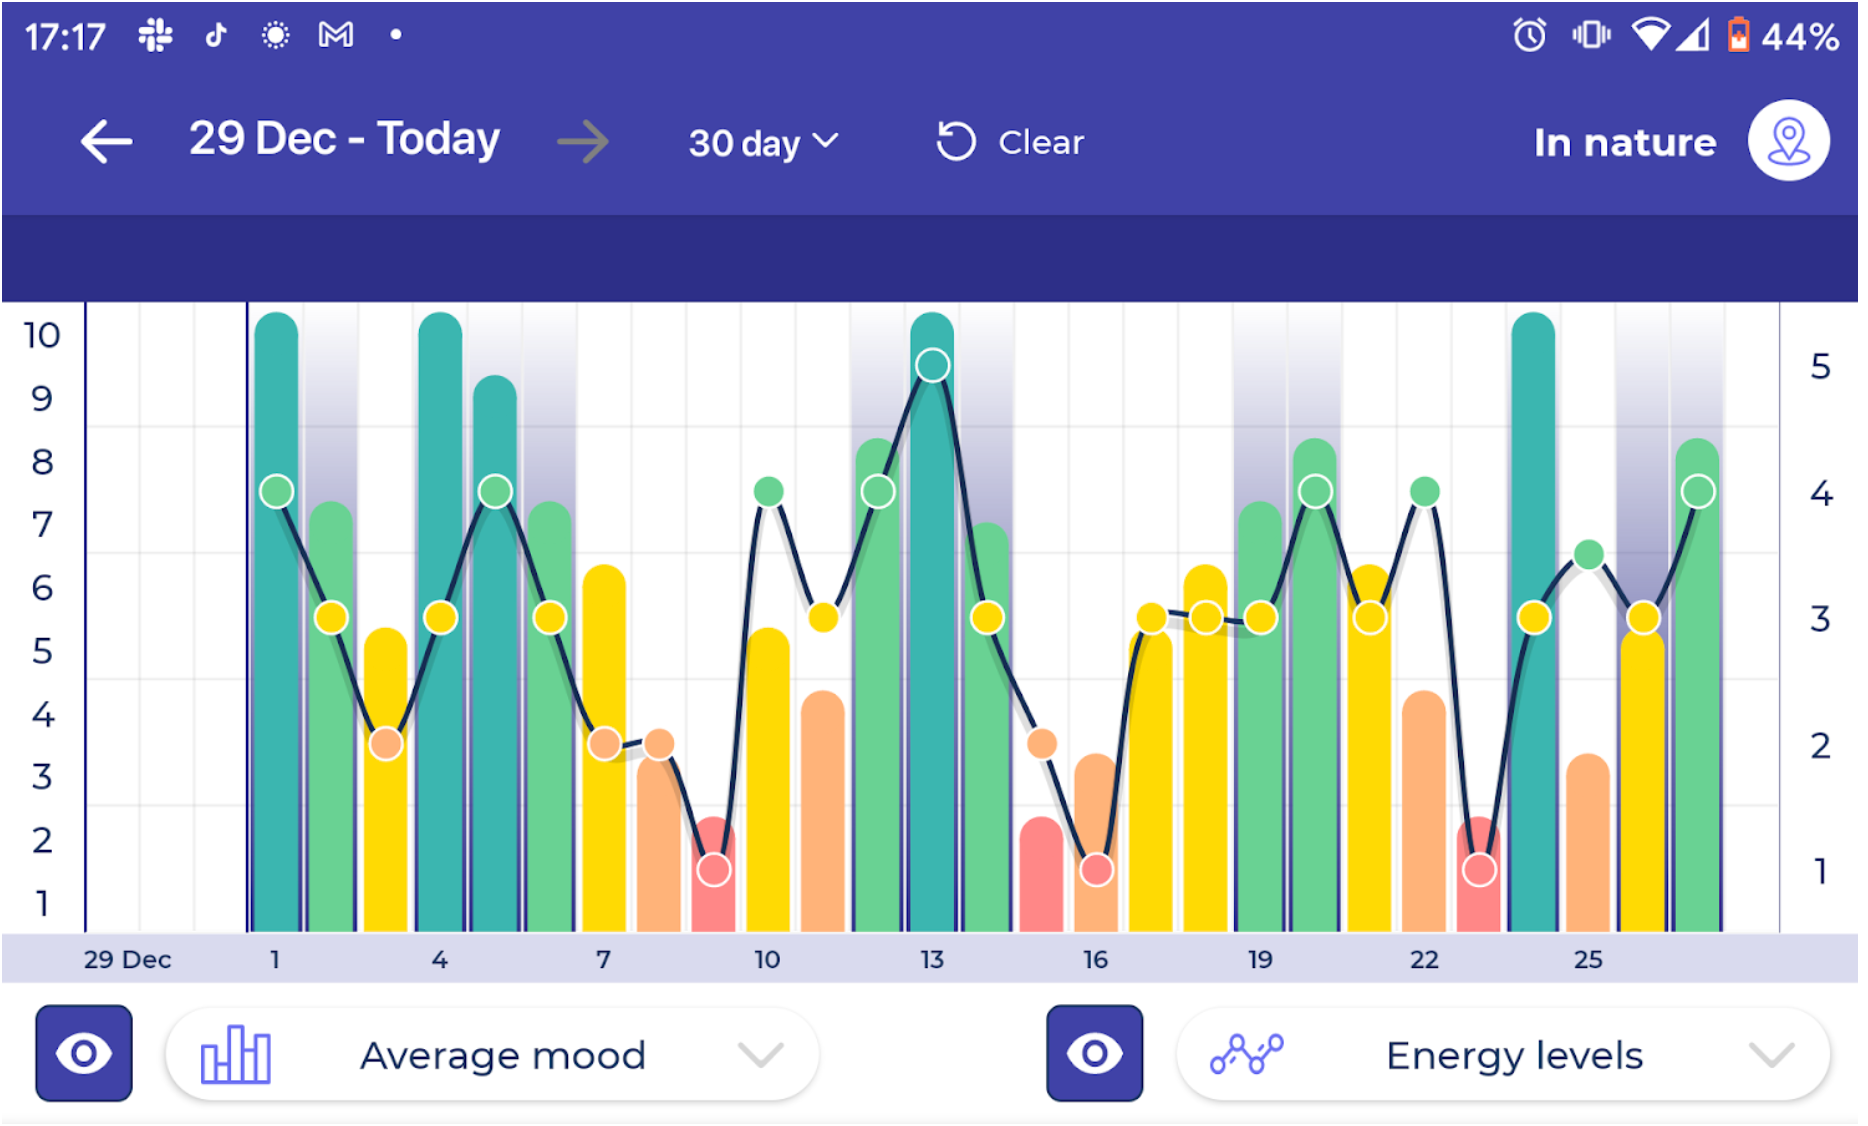
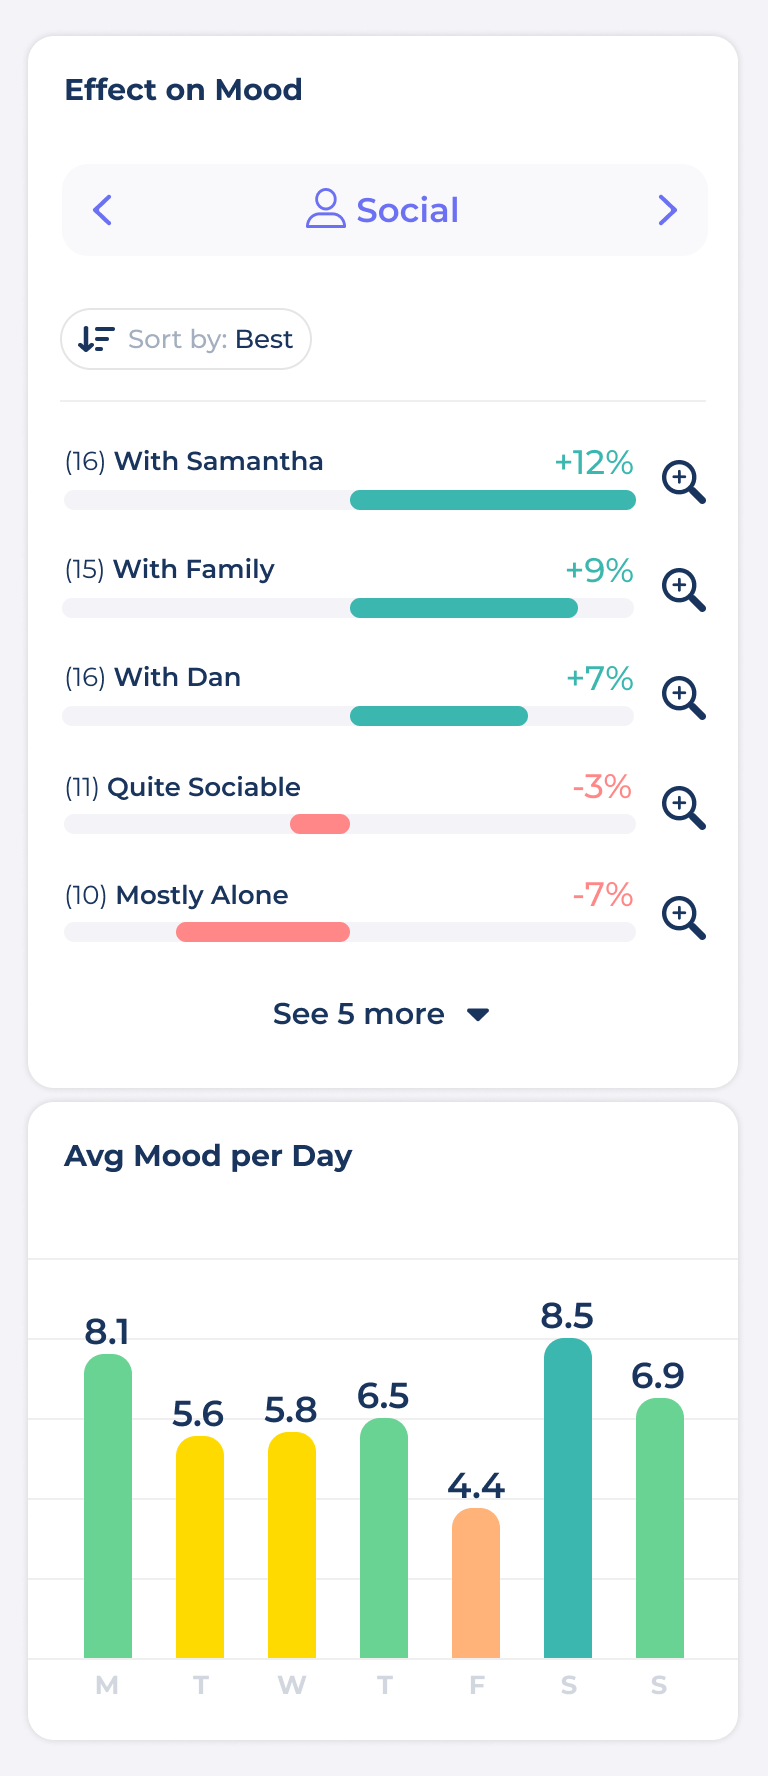
📊 How to use Insights to compare your symptoms?
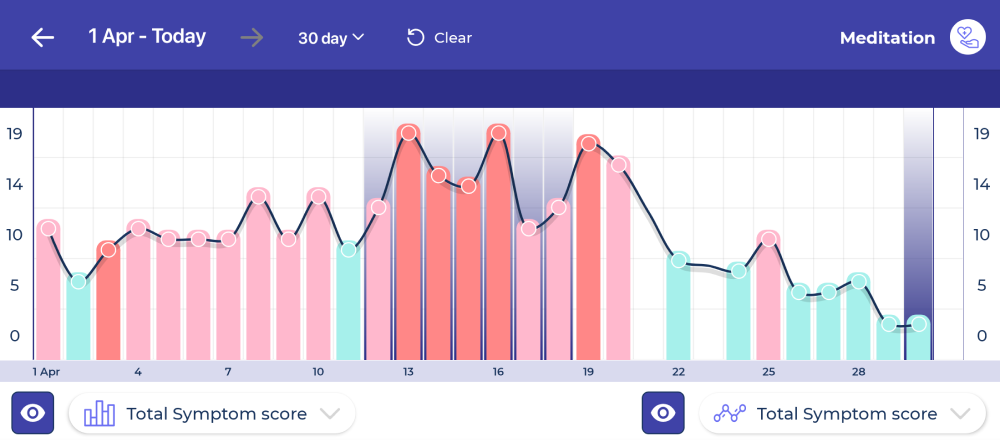
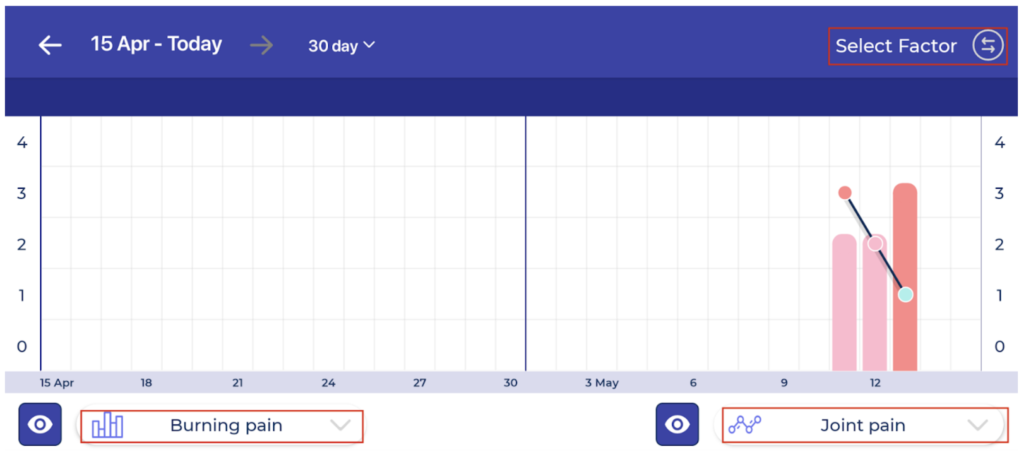
“The graph that maps out 2 different symptoms and how they interact is really interesting. I’ve been able to see how migraine days affect nerve pain immediately after and days later, and see patterns that have helped me know what to tackle next in possible treatments.”
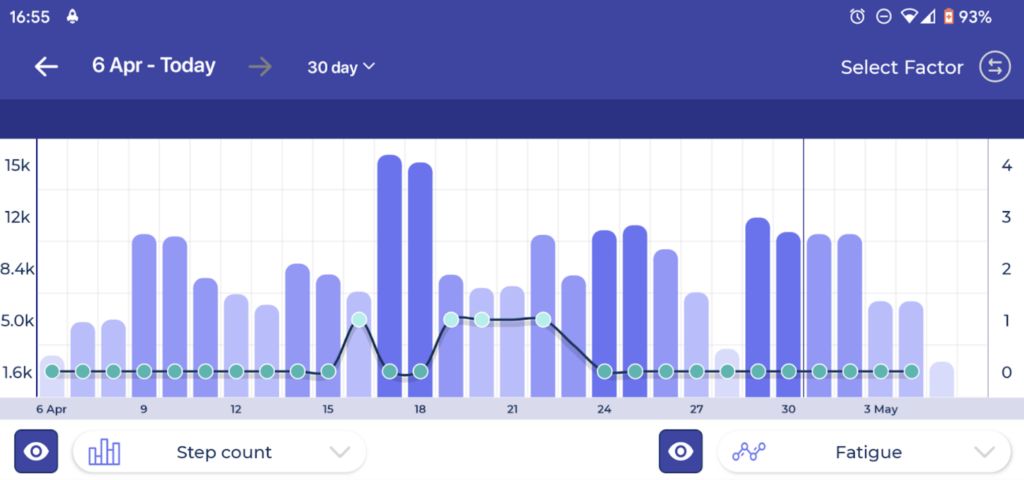
This user is making use of the comparison graph to compare symptoms. To do this you can:
-
- Go to the Insights tab
- Rotate your phone 90 degrees (make sure your screen lock is off)
- Using the left-hand button below the graph select a Symptom and it will appear as bars on the chart
- Using the right-hand button below the graph select another Symptom and it will appear as a line on the graph
- You can now look for correlations between trends in your symptoms
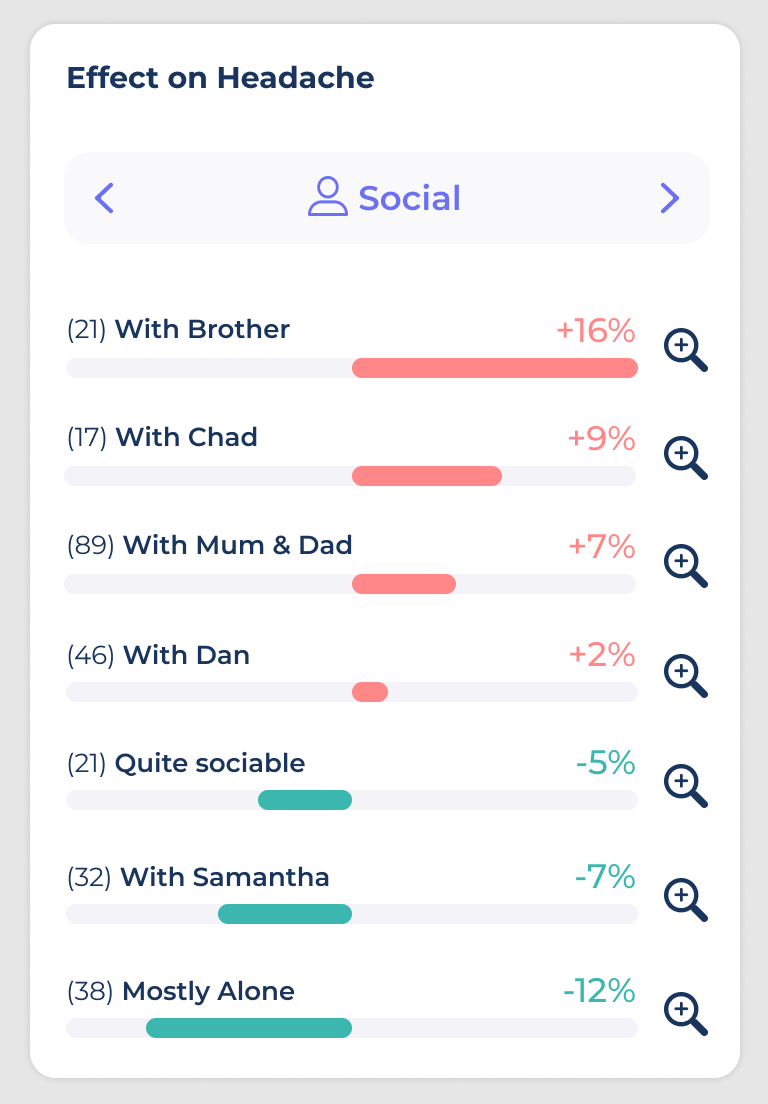
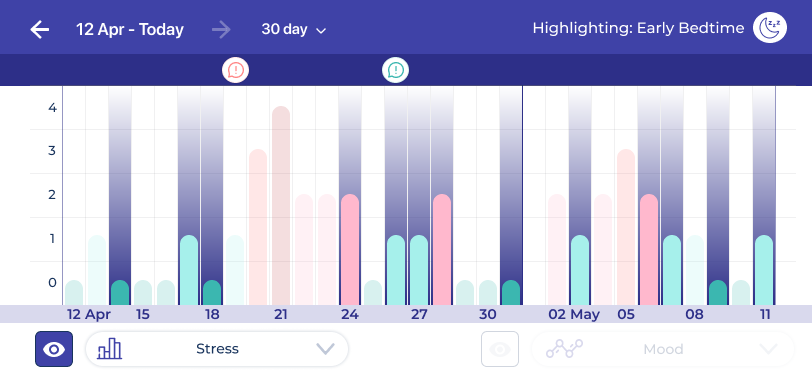
📈 How to use Insights to compare symptoms to Factors?
“I wanted to be able to find out how various factors (such as medication or what I do) affect my mental health and physical issues. Trying different medication, different routines, even changing therapists – I wanted to actually have the data to see what works best.”
If you want to compare your Symptoms to Factors like medication and activities you can:
-
- Use the comparison graph (using the steps above) and click the top right hand button Select Factor to plot a factor onto the graph. OR
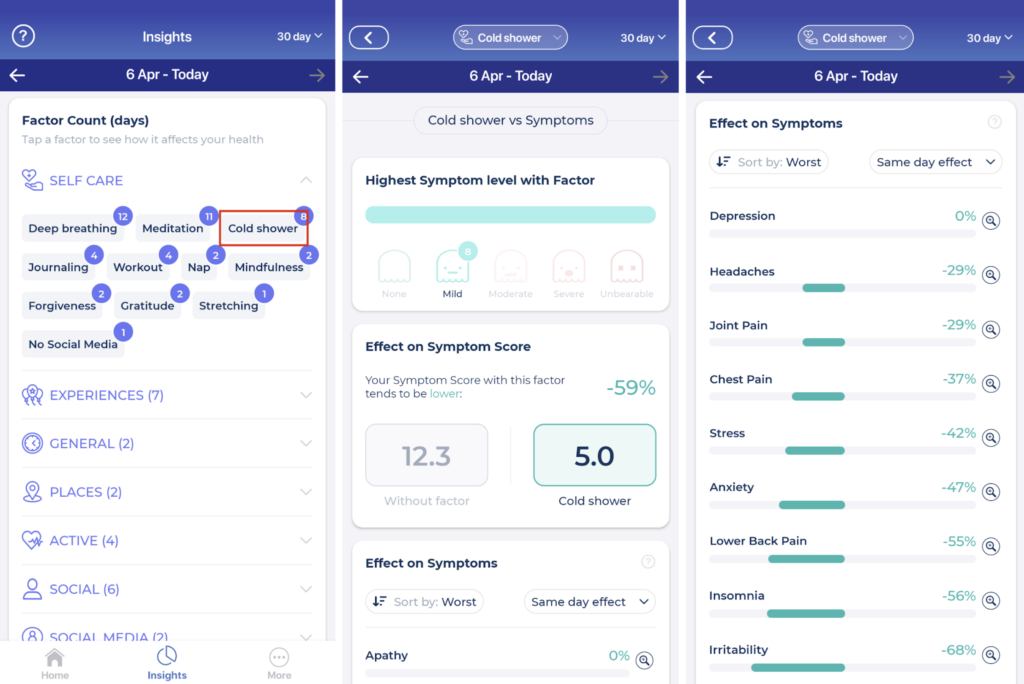
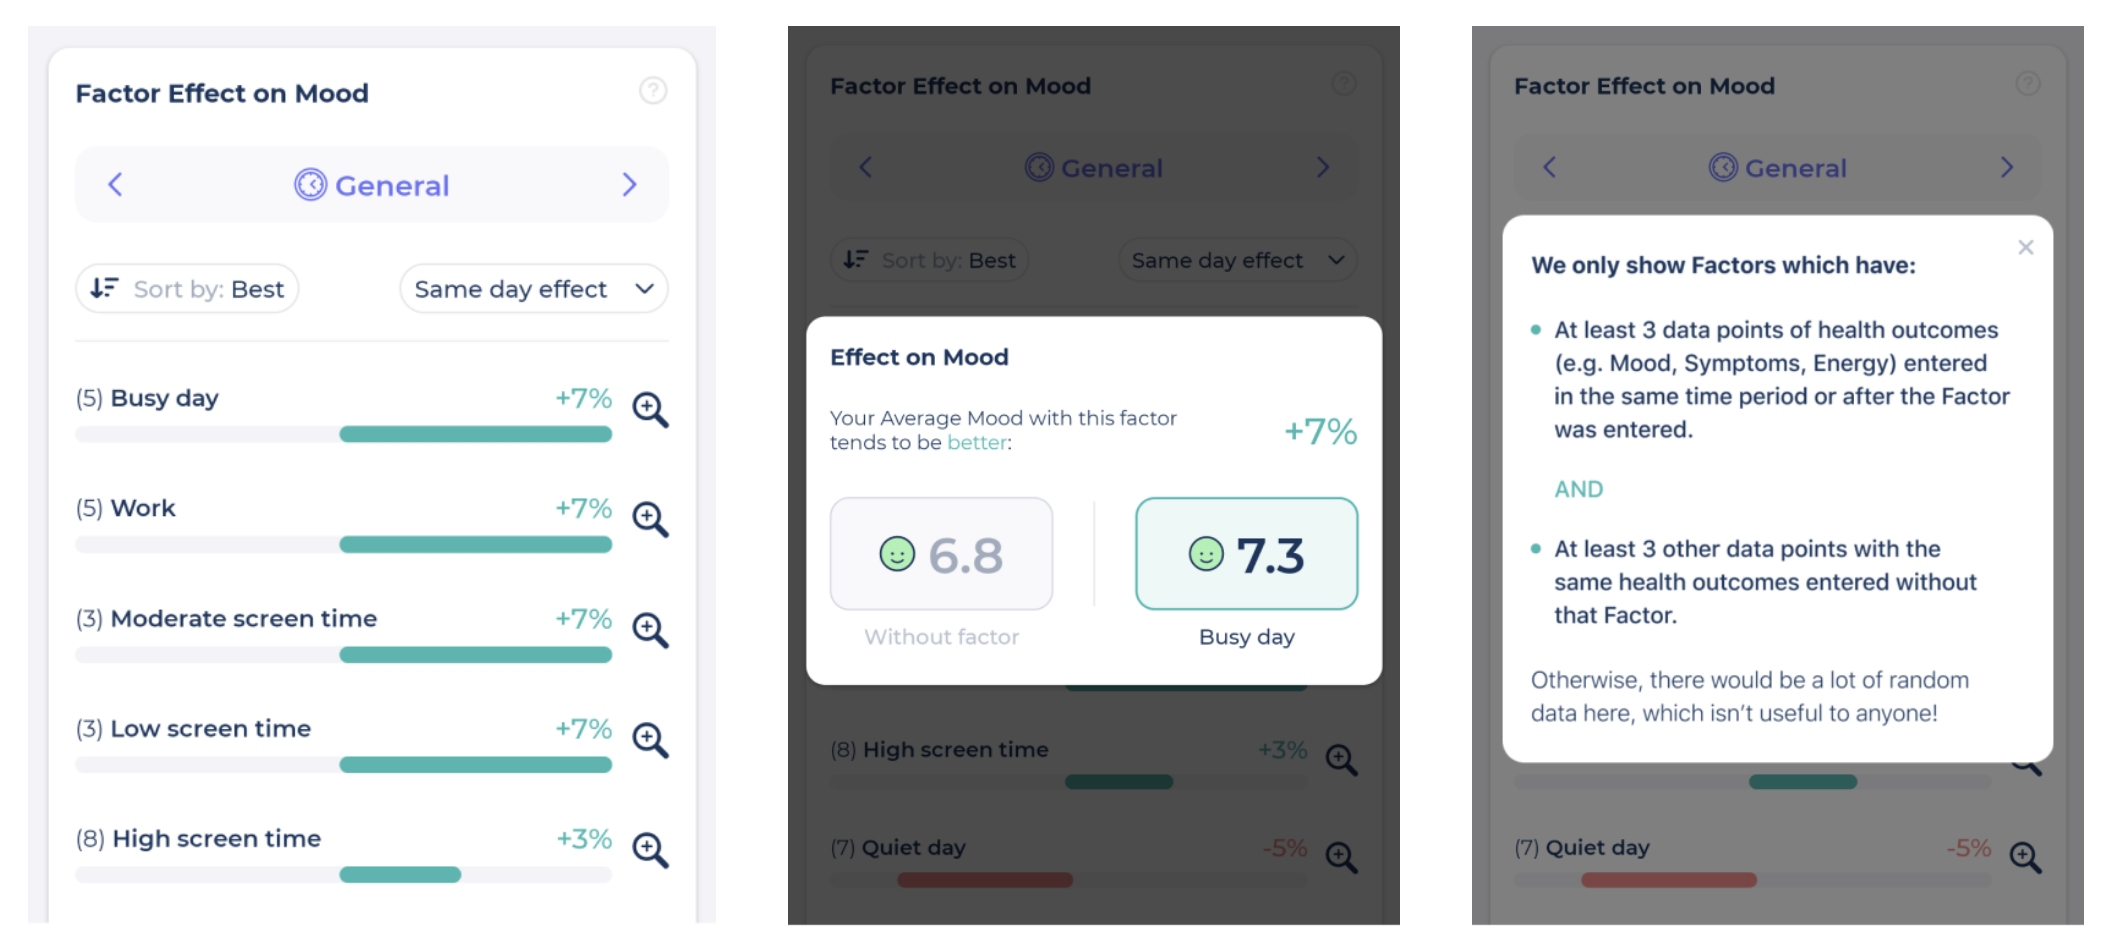
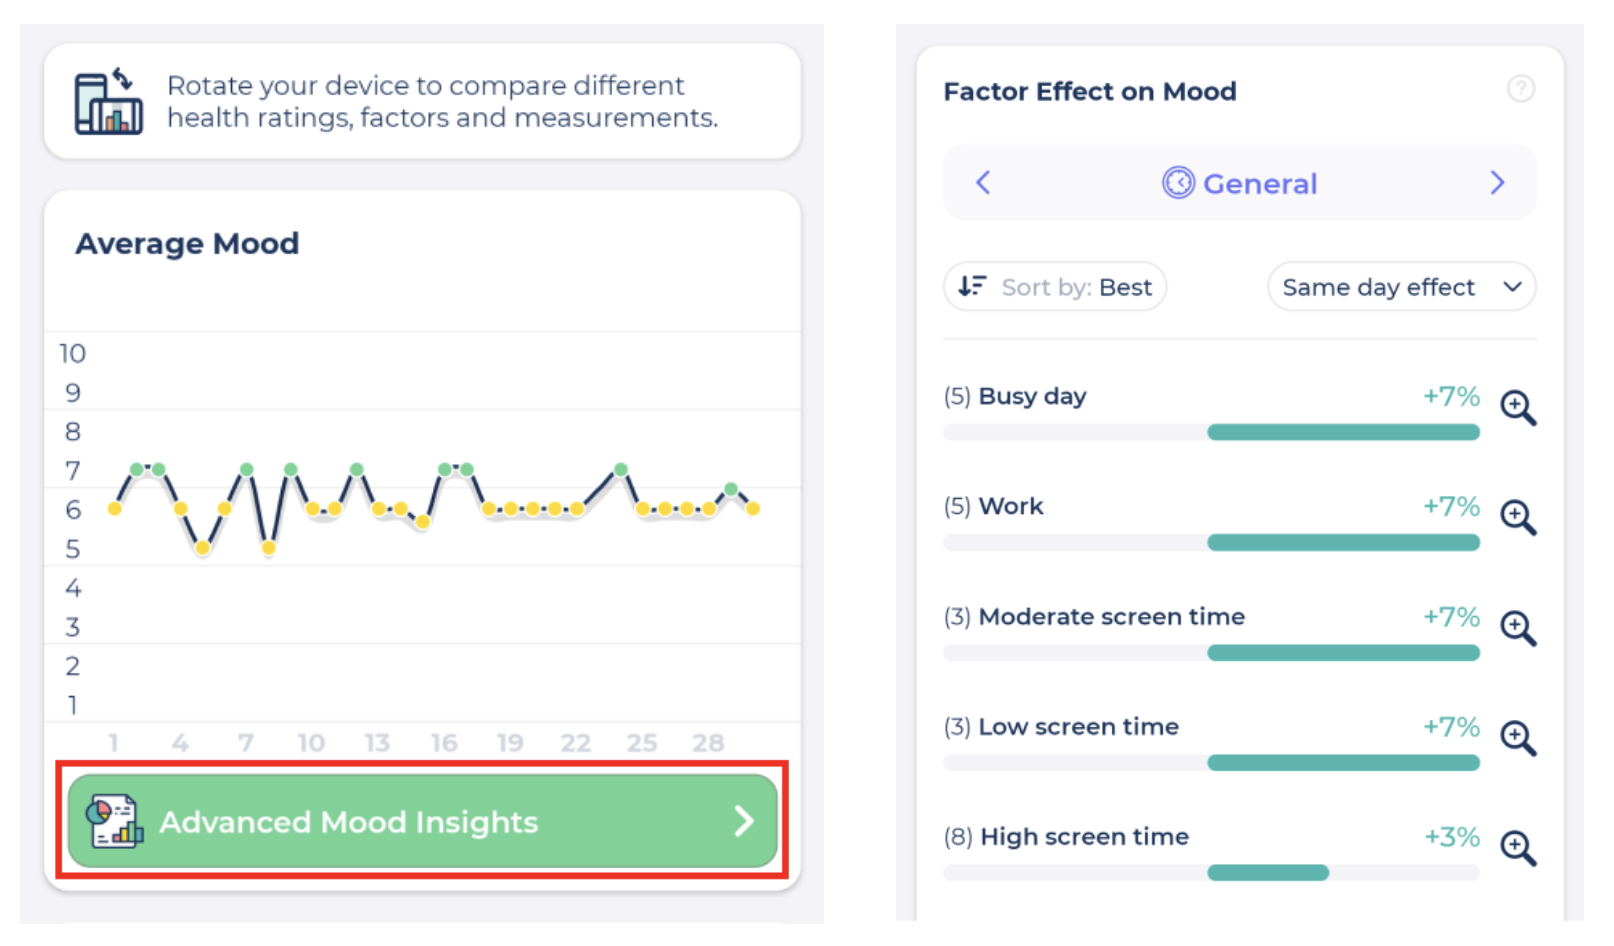
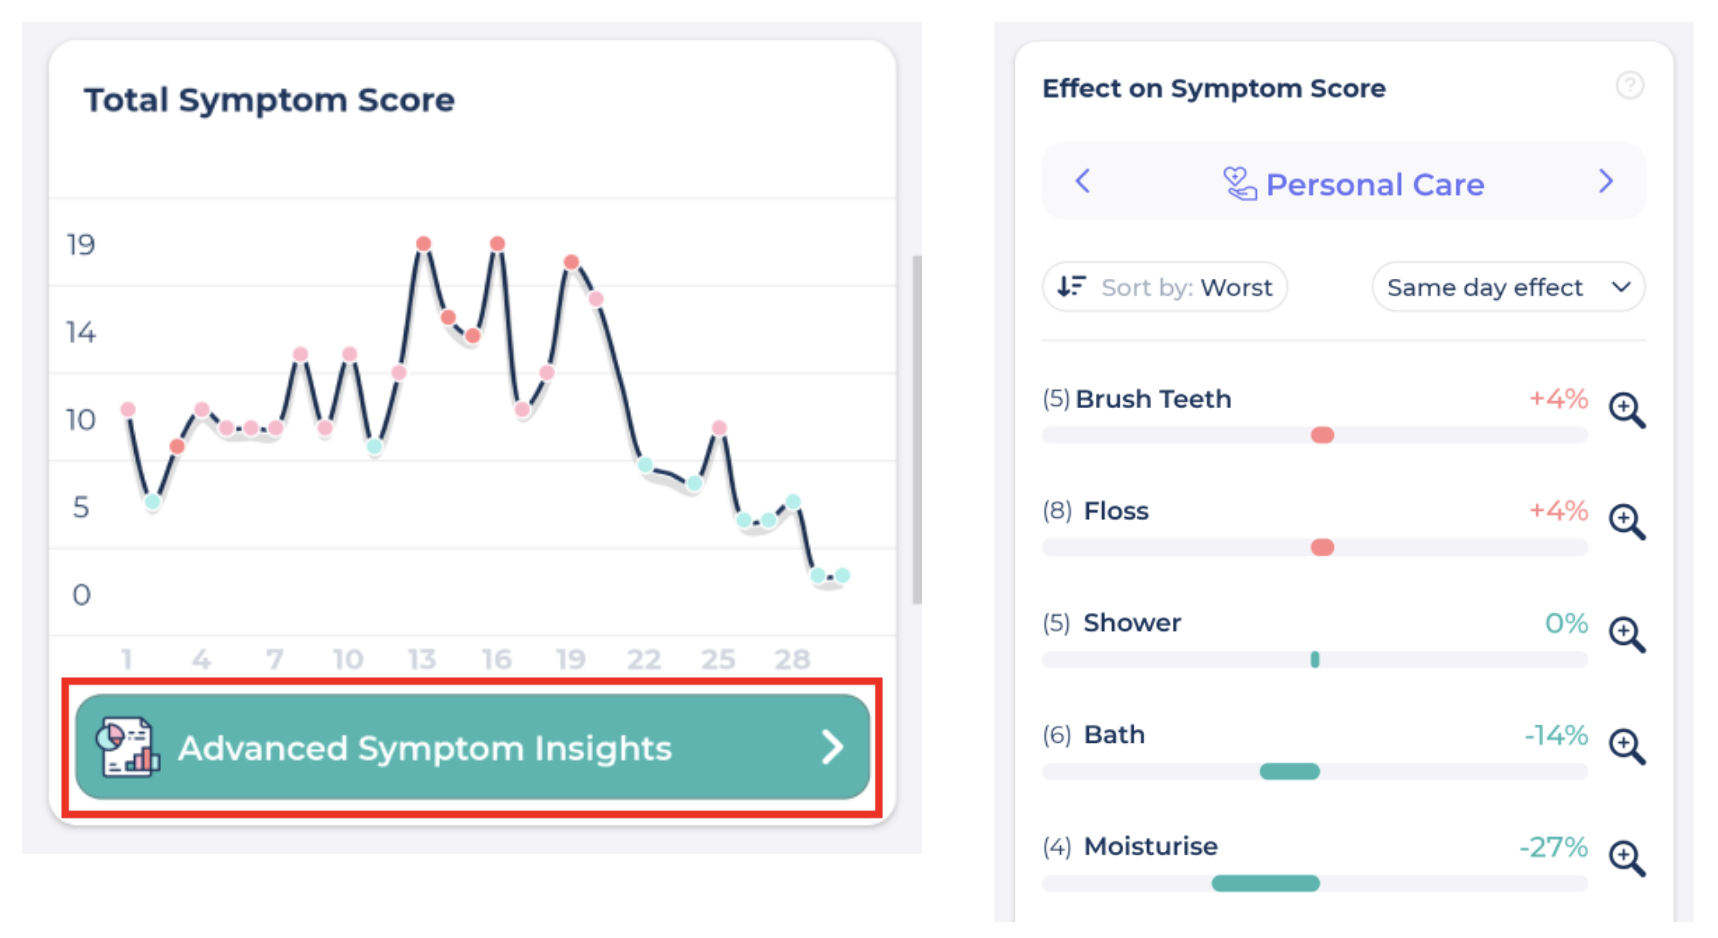
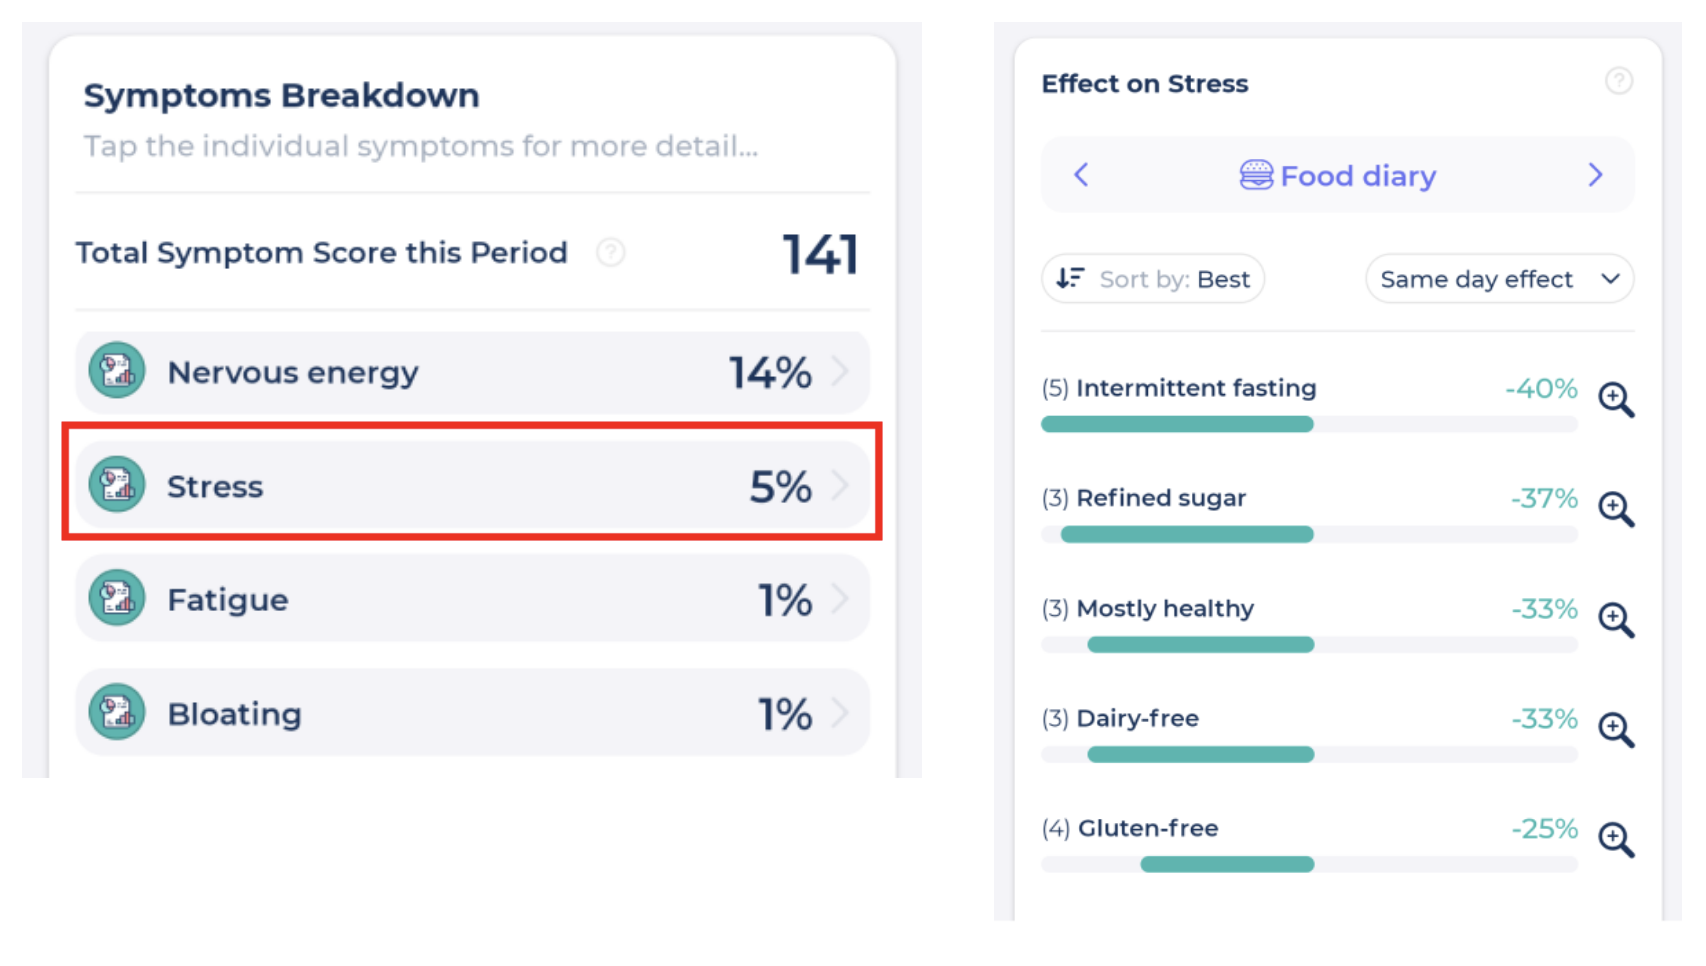
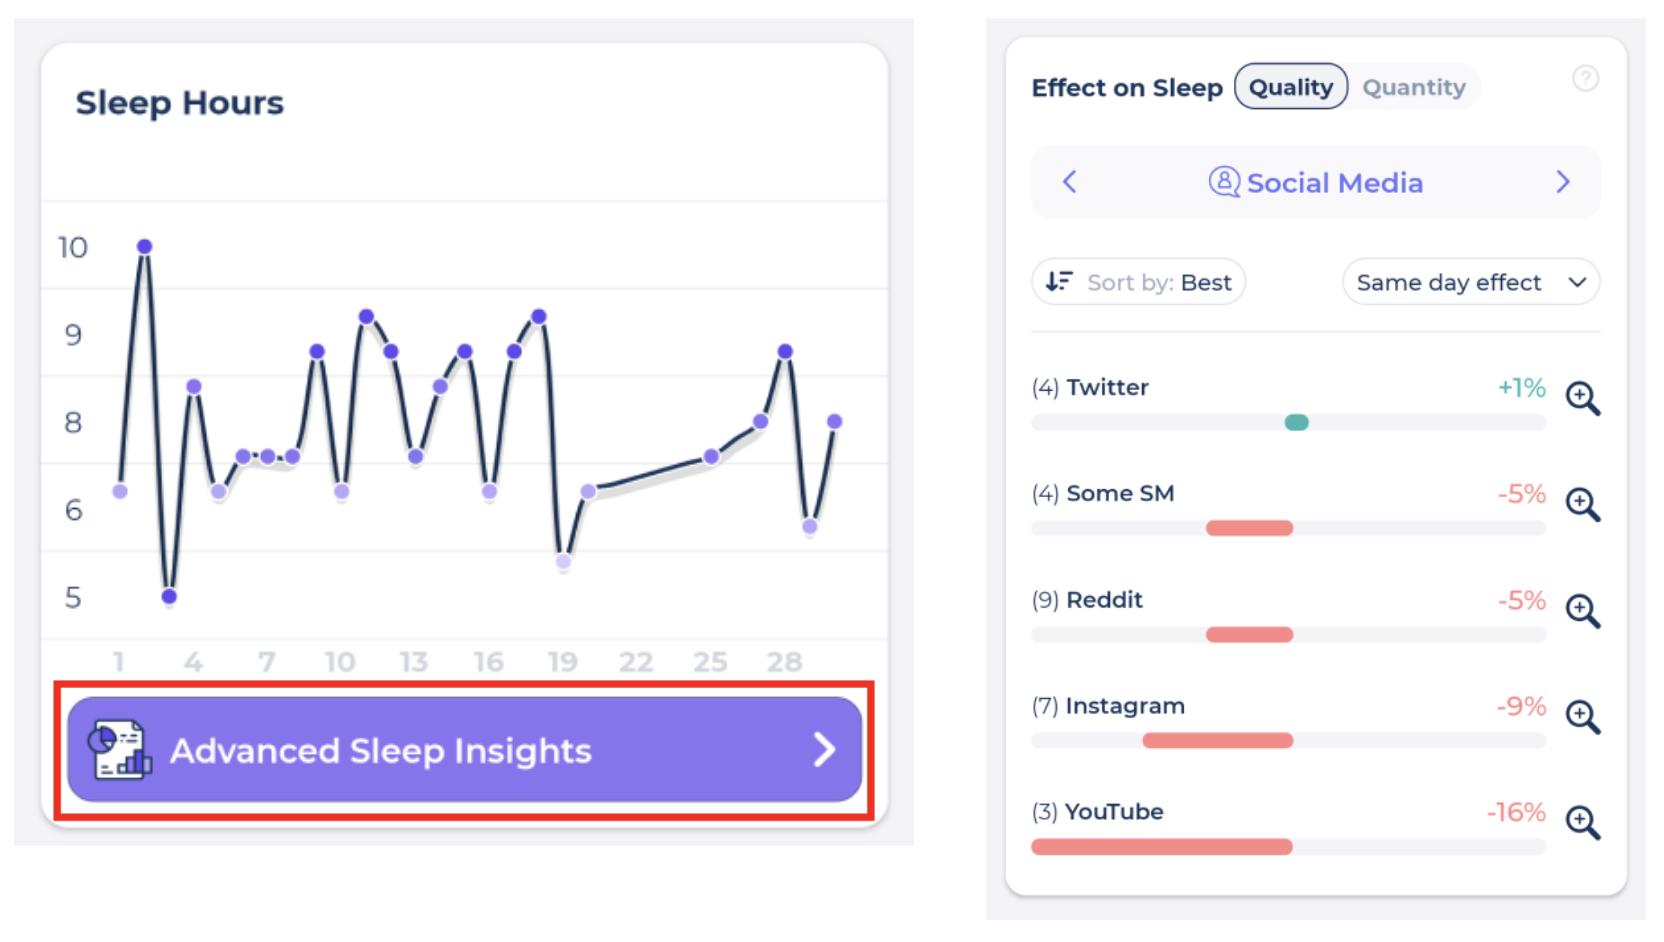
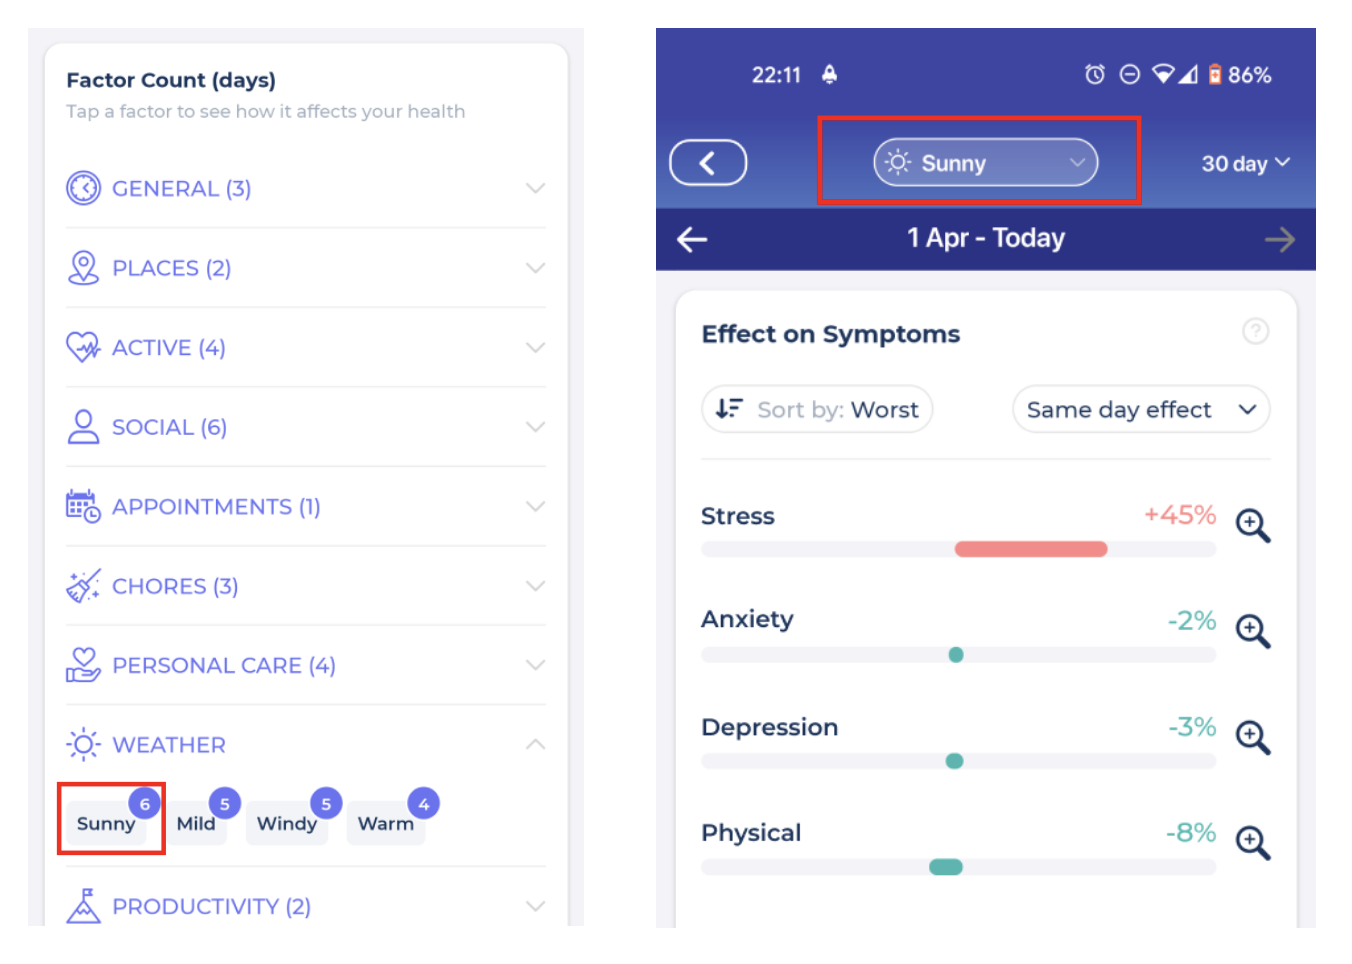
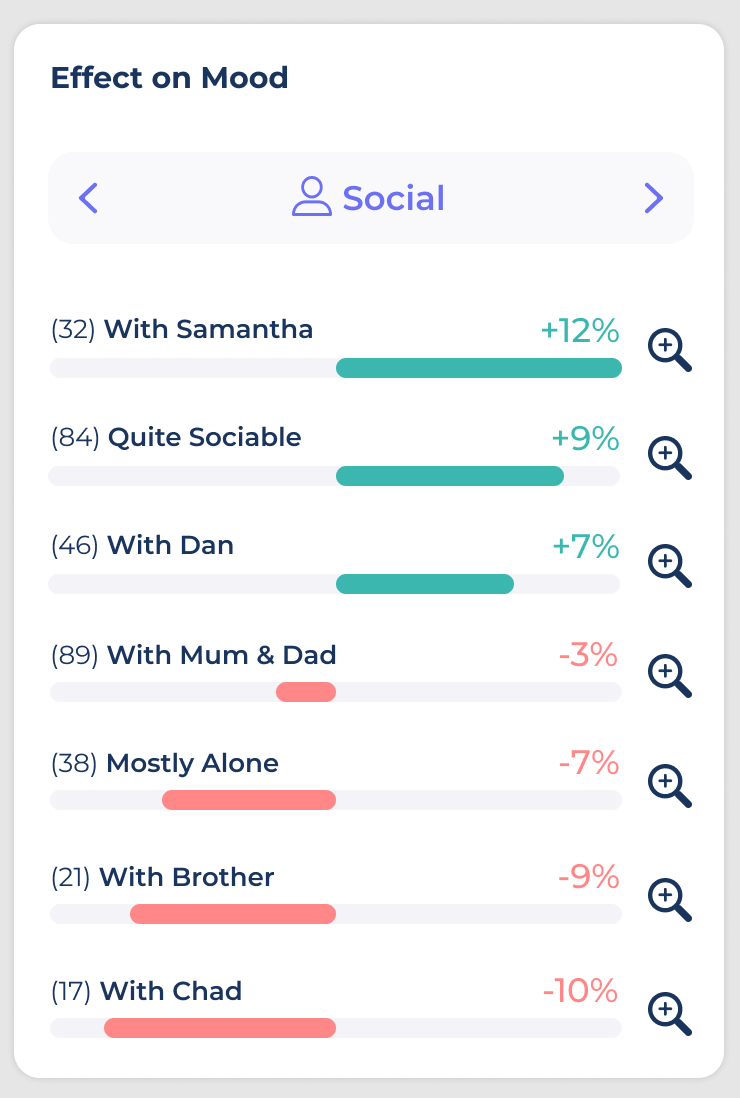
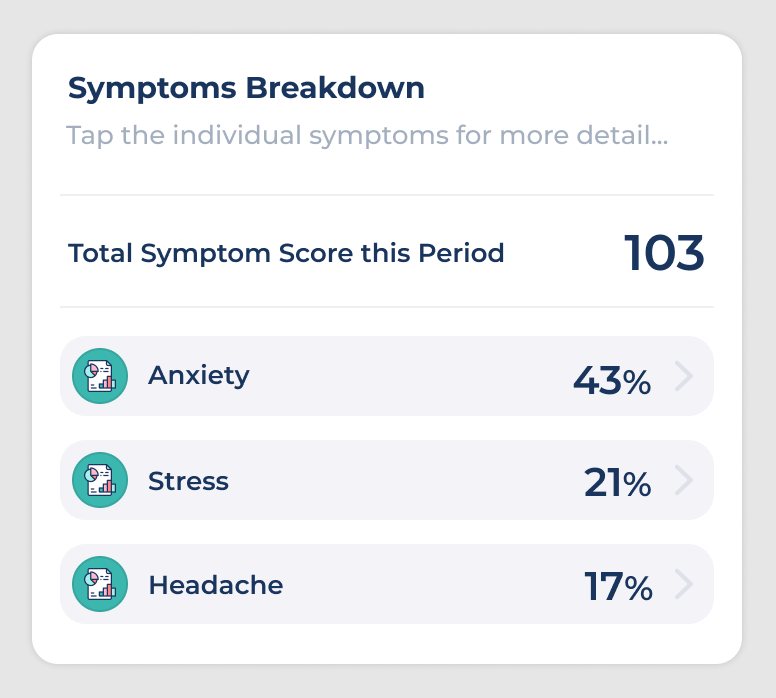
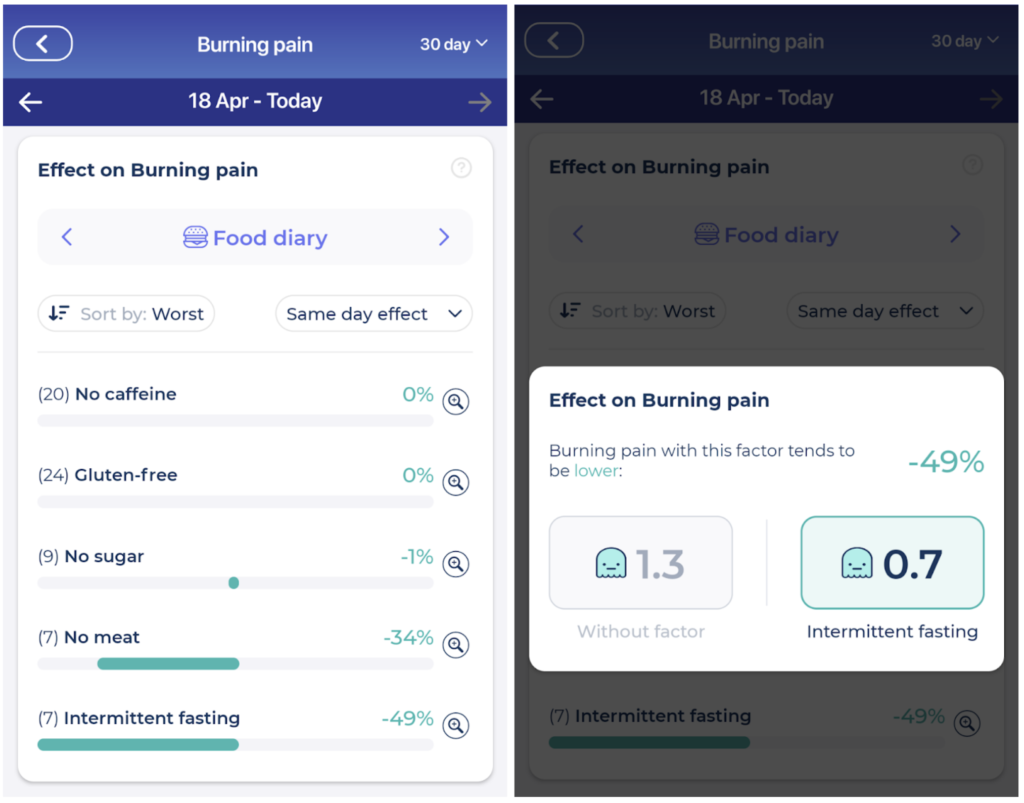
- Visit the Insights tab and click on your individual symptoms in the Symptom Breakdown Section and scroll down to the Effect On Symptom report to view the Factors that correlate with changes in that Symptom.
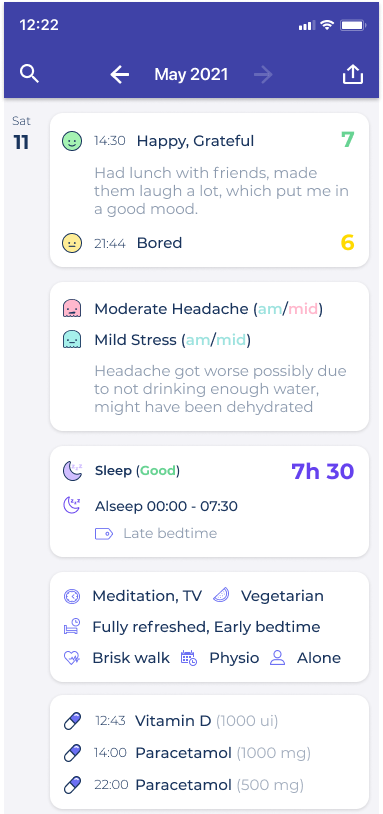
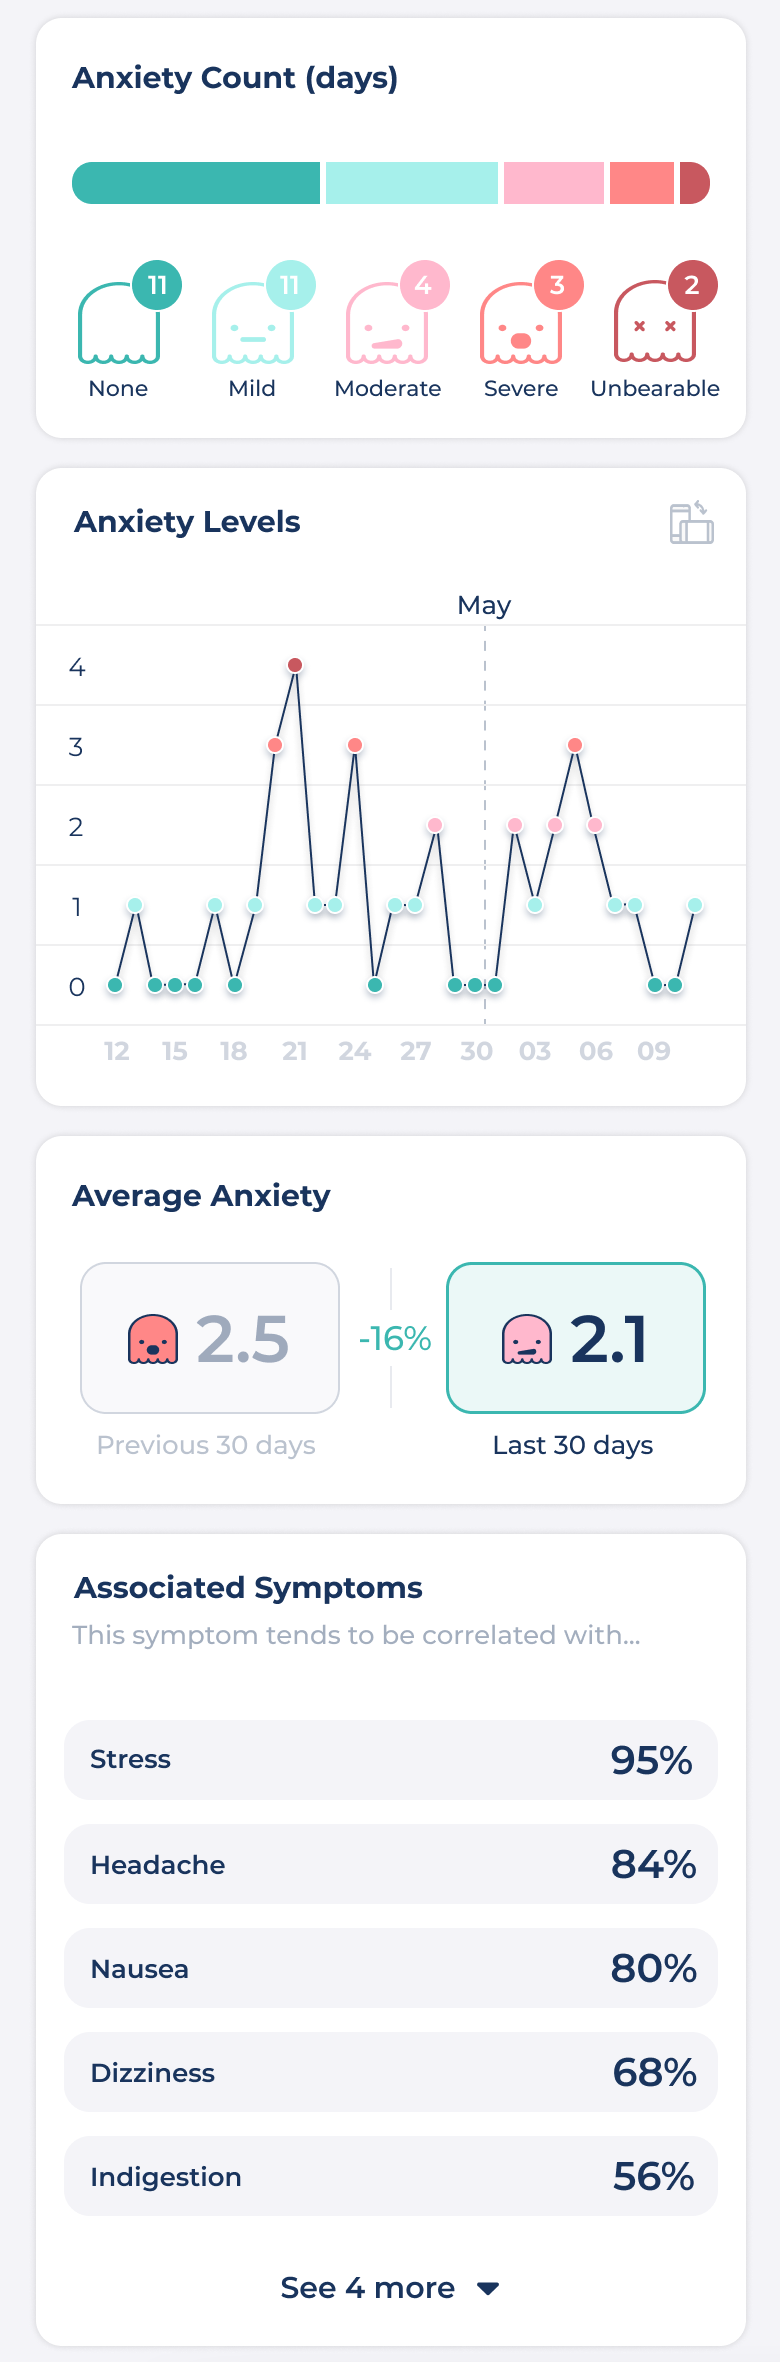
🗓️ How to look for correlations and flare-ups on specific days?
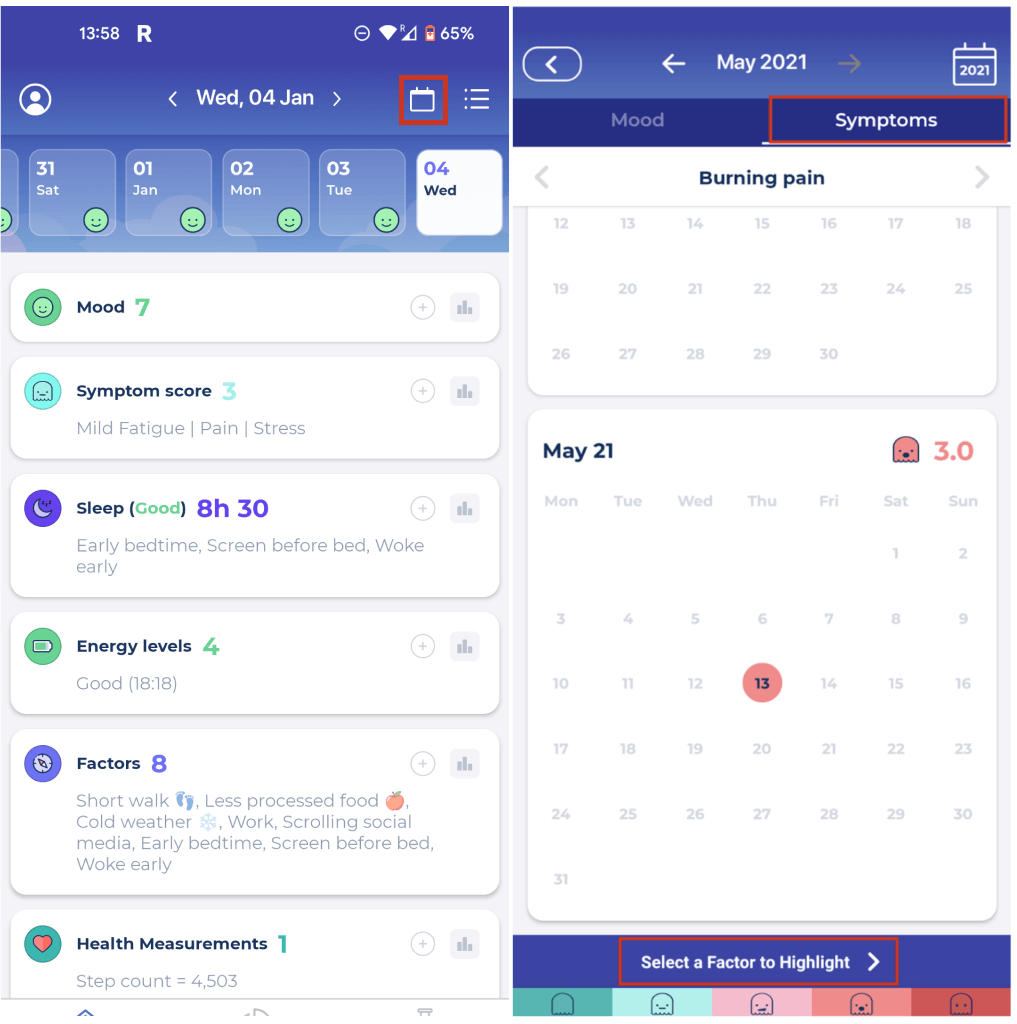
“Recently I’ve been finding the calendar view helpful, e.g. during doctor visits (“this is when/how often…”) or to determine whether something is correlated with my period.”
This user has found the calendar view useful for finding correlations over longer periods of time and to pinpoint when specific symptoms flared up. To look at your symptoms in the calendar view:
-
- On your home screen click the icon in the top left-hand corner next to the date
- Using the two tabs at the top of the screen, select Symptoms
- Toggle through symptoms using the left and right arrows at the top of the screen
- Symptoms will appear as dots on the calendar for the days you tracked them
- The colour of the dot indicates the severity of the symptom
- To look for correlations with Factors you can click on the “select a factor to highlight” button at the bottom of the screen
- Factors will appear as dark rings around the dates they were tracked
—
If you’re a Bearable user that’s living with symptoms that include pain and want to submit your own recommendations for other users. We’d love to hear from you. You can submit your advice here.