How Can We Help?
Visualising your health data in many forms
Once you’ve made a few entries it might be useful to know all of the ways you can visualize your data with Bearable:
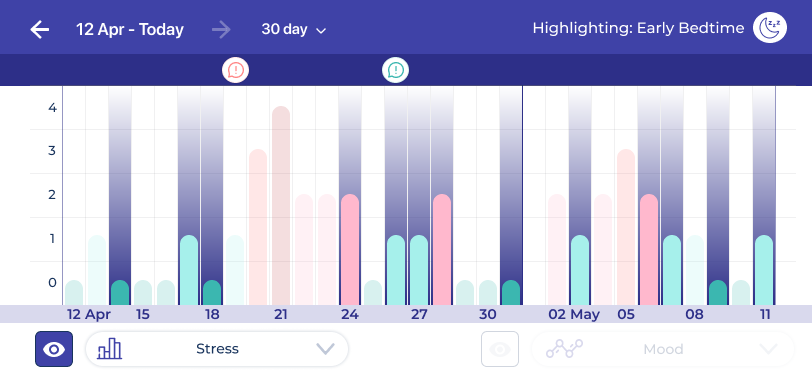
📊 Comparison Graph
One of the best ways to spot patterns is by using our comparison graph. Access this by rotating your phone on the Insights Page.
You can then compare your Mood, Symptoms, and Energy Levels to anything else, such as; Sleep, Water Intake and Health Measurements like Steps and Heart Rate (plus any custom measurements you’ve created).
You can also highlight days with certain Factors (including medication) by pressing the “Select Factor” button in the top menu.
🗓️ Calendar
See how your Mood or Symptoms change over time via the Calendar button on the homepage.
You can highlight days with certain factors here too by pressing the “Select Factor to Highlight” button at the bottom of the page.

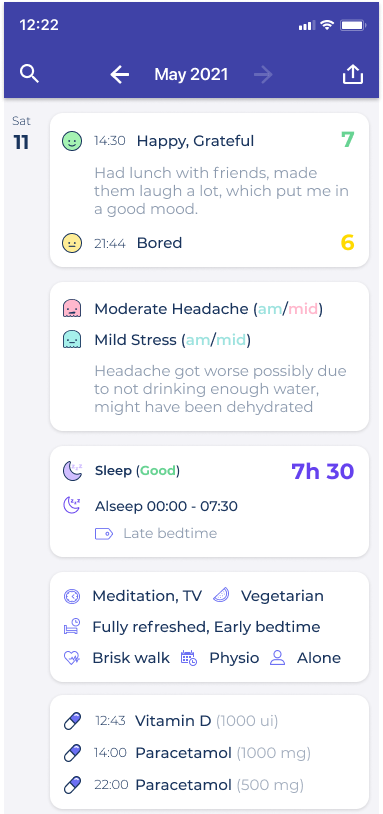
📝 Timeline
If you want to see your entries listed out in more detail, including things like additional notes, visit the timeline by pressing the 3 horizontal lines in the top menu of the Homepage.
There is a quick filter at the top of the timeline page for you to immediately just see e.g. only your mood entries. To type a keyword search and go into more detail you can press the magnifying glass icon. There is also the option to export these entries by pressing the Share icon in the top menu.
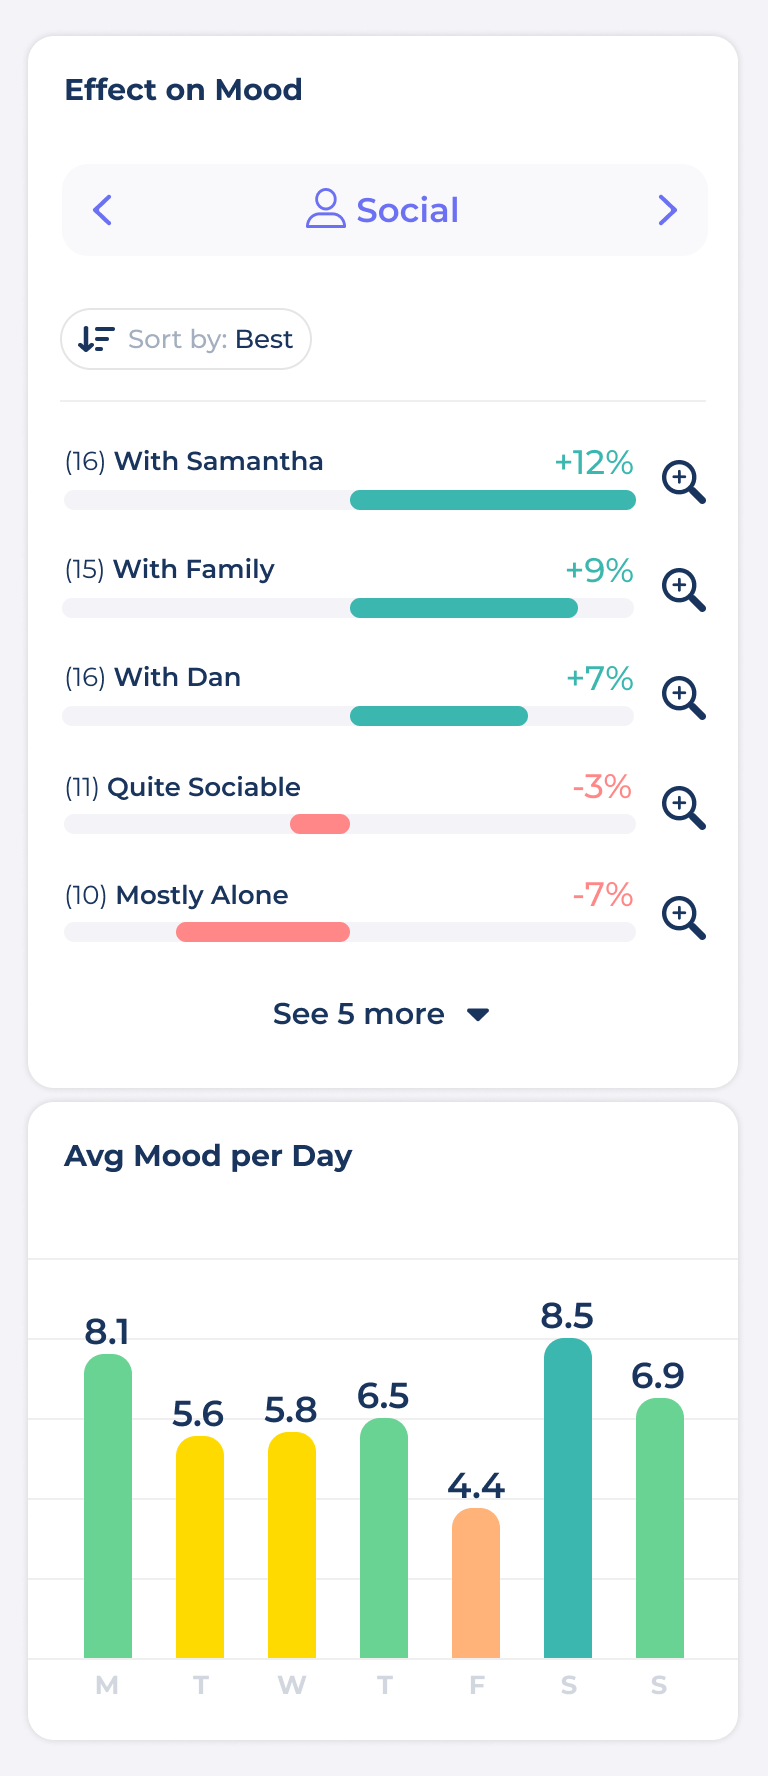
💎 More detailed insights
Once you’re ready to gain deeper, more detailed insights you can unlock premium.
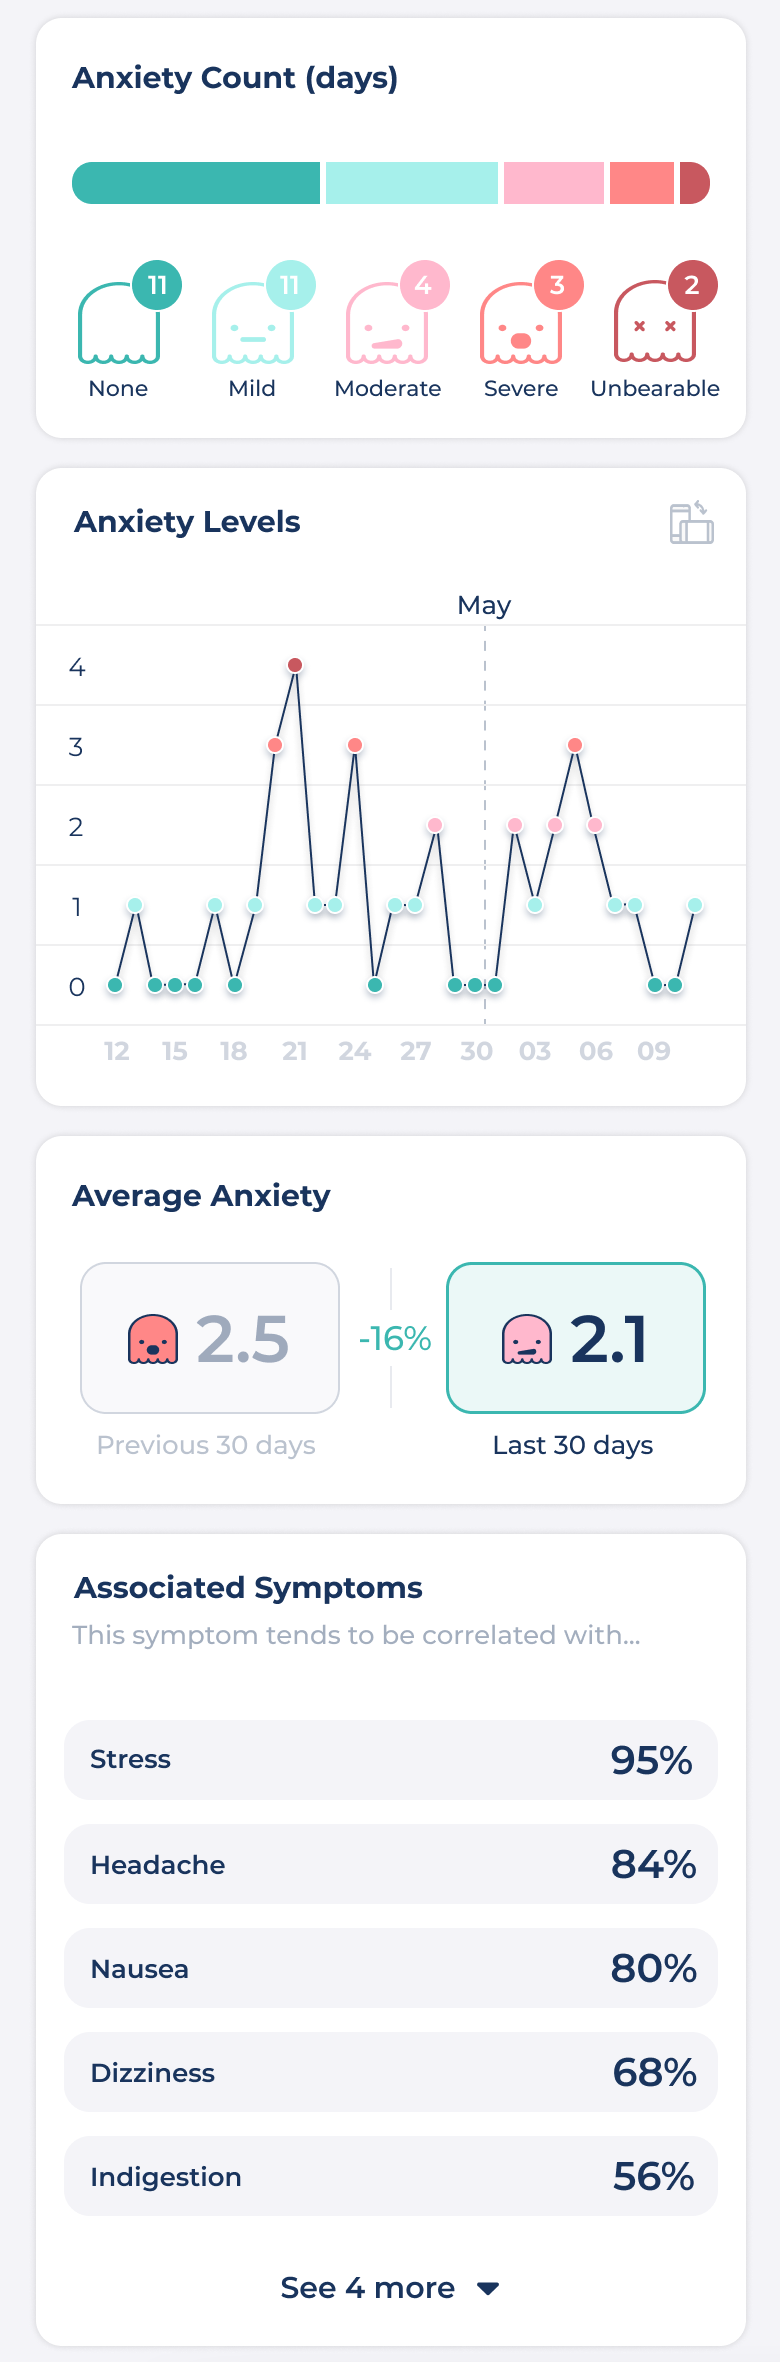
This will give you access to unique charts and correlations, such as the % effect each factor has on your Mood, Symptoms, and Sleep, plus how these change based on time of the day/week.
You’ll also be able to view reports for individual Symptoms (under Symptoms Breakdown) and Factors (under Factor Count) for more specific insights.
As always feel free to reach out to our community on Reddit or Twitter for more advice, support, and inspiration.
✋ Looking For More Info?
-
- Check out our support blog for answers to common questions.
- Post questions on our subreddit or chat with users on our discord server.
- Take a look at our blog to see how Jesse learns about his health with Bearable.