No. For the time being, our app is designed to work and sync seamlessly on one device.
This is what most of our users require, but we totally understand that you may benefit from being able to sync Bearable on more devices.
We do have plans for multi-device capabilities (i.e. instant updates across devices), but this is fairly complex to implement for a product at our stage, hence why you usually only see it done by bigger companies (e.g. Google products, messaging apps, etc.).
In the meantime, to make sure you get the best experience possible, please use Bearable on one device.
Using multiple devices simultaneously can lead to data conflict issues and thus result in data loss.
👉 To clarify, you can still move permanently to another device, simply by logging out of device A and staying logged in on device B, you just can’t be logged into both simultaneously.
No. It’s not currently possible to track more than one person per Bearable account. However, we are considering ways to make this possible in the future.
As a workaround solution, it is possible to label custom symptoms and factors with names e.g. ‘10,000 steps (Joe)’ and ‘10,000 steps (Jane)’ or ‘Anxiety (Joe) and ‘Anxiety (Jane). This might allow you to view correlations and trends for multiple people within a single account. However, this isn’t possible for a number the app’s features such as Moods, Sleep, Energy, Nutrition, BMs, etc.
We’ve heard from the Bearable community that they’ve had the best outcomes when they’ve prepared for their appointment as opposed to just exporting and sharing data with their doctor.
Preparation for a medical appointment will likely include:
Reviewing recent trends in symptom severity.
Reflecting on the impact of your health on your ability to work, socialise, and take care of yourself and/or your family.
Analysing the effectiveness of different treatments or medications on your health.
Preparing questions for your medical team based on your data.
Identifying your most severe and most prevalent symptoms since your last appointment.
Screengrabbing relevant trends & impacts reports to share with your doctor.
Use the Trends tab to spot patterns over time
Tap the Trends tab in Bearable.
On the first symptom chart, use the arrow icon to highlight a specific symptom.
Browse the graph and summary for changes over days, weeks, or months.
Alternatively, you can use the Symptom Prevalence section to identify your most frequently occurring symptoms and tap on each of them to view more info.
You can also use the Factor Breakdown section to see counts of your activities over the selected time period and tap into these to view correlations and other reports.
👉 Use this to answer questions like:
When did the pain start getting worse?
Has my mood improved since I changed meds?
Am I sleeping better on weekends?
Using the Timeline and Calendar Features
Bearable’s Timeline and Calendar features allow you to review your health data over time:
Timeline: Provides a chronological view of your entries, helping you recall specific events or patterns. You can also filter and export specific categories of metrics such as symptoms, moods, notes, etc.
Calendar: Offers a monthly overview, useful for identifying trends or recurring symptoms.
These features can be helpful during appointments to discuss specific periods or events.
Exporting Your Data
You can export your data from Bearable to share with your medical team:
Open the Bearable app.
Tap the Settings (⚙️) icon in the top corner
Scroll down to the Data + Security section
Tap on My Data
Choose Export My Data.
Select the period of data you’d like to export (3 months, 6 months or All time)
Follow the prompts to generate and share your data file.
This export includes your tracked metrics such as mood, symptoms, sleep, and more.
👋 Still have questions?
Let us know by contacting support@bearable.app and a member of the Bearable team can help you with anything you need.
Right now, it’s not possible to sync local weather data into Bearable. However, it is possible to track the weather and the impact the weather has on your symptoms.
You can follow the steps below to customise Bearable to track the weather.
In the Other Factors section of your home screen, tap on the … icon
Then, on the menu that appears, tap the ‘add/edit’ option
You should now see a category named ‘Weather’
If the weather category isn’t enabled, tap the toggle to turn it on
Tap into the weather category
Toggle on or off the aspects of weather you’d like to track
Use the search bar at the top of the category to add new options
When creating a new option, you can select between binary (happened vs. didn’t happen) or variable (happened a little, moderately, or a lot).
💡If you’d like to track aspects of the weather using specific metrics such as Air Quality, we recommend creating binary factors to track these in ranges such as:
AQI = 0 to 50 (good)
AQI = 50 – 100 (moderate)
AQI = 100 – 150 (poor)
AQI = 150 – 200 (Unhealthy)
AQI = 200 – 300 (Severe)
AQI = 300+ (Hazardous)
This will help you to see correlations sooner and can be used for a number of weather-related measurements, such as:
Humidity
UV index
Rainfall
Wind Speed
Pollen
👋 Still have questions?
Let us know by contacting support@bearable.app and a member of the Bearable team can help you with anything you need.
Right now, Bearable only reads data from other health apps—it doesn’t write data back to them.
That means Bearable can import data like steps, sleep, and heart rate from apps like Apple Health, Google Health Connect, and Fitbit. But it won’t send your symptom logs, mood ratings, or other Bearable entries back to those platforms.
We know this would be a useful feature for some people, so it’s something we’re exploring for the future!
💡 Please note. This feature is in testing and being rolled out slowly so you might not see it yet.
About Period Tracking with Bearable
Below you will find some information to help you set up Period tracking in Bearable.
We are a little different from other period-tracking apps as our focus is on people with chronic health conditions. Unlike some other period tracking apps we don’t make predictions about your period or symptoms. Our aim is primarily to record your cycles so that you can better understand the impact they might have on your health.
We take privacy extremely seriously. We know how important this information is, especially given the current political climate. All of your information is encrypted and held on servers in Europe. As a UK company, we are bound by strict rules about how we handle your data. You have full control and can delete your data (including from our servers) at any time, from the app. Importantly, as a UK company, we’re not required to have to comply with US criminal subpoenas requesting disclosure of data.
If you have any other questions or concerns don’t hesitate to reach out to support@bearable.app. We would love to hear from you.
Why implement period tracking now?
Period tracking is one of our most requested features and it has been on our roadmap since first building Bearable. It’s a hugely important factor that can help so many of us understand our health better.
We know many users don’t feel safe tracking their periods right now. Period tracking is completely optional in Bearable and if you don’t feel comfortable using this feature, you don’t have to.
However, we’ve taken steps to make sure this data is as secure as possible.
We don’t store this data locally on your device.
We are a UK company, meaning we have much stricter data privacy laws. We will never share your data. We are not required to have to comply with US criminal subpoenas requesting disclosure of data.
The data is stored on European servers and is encrypted, meaning our server providers cannot read the data.
You can delete your cycle data at any time (including from our servers) from within the app. Just go to Settings > My Data > Delete my period tracking data
You can set an additional Passcode Lock from the settings menu, a four-digit PIN which can prevent anyone from accessing the app, even when they have access to your device.
How do I track my cycles in Bearable?
You can simply log when you menstruate and Bearable will estimate the phases of your cycle based on your input.
There is a toggle called ‘On period’. Switching this on will start a new cycle. It will remain on for the duration of your expected period length, after which it will automatically toggle off.
If your period ends earlier than estimated you can manually turn this toggle off again. If it lasts for longer than usual you can toggle it on for the extra days.
💡 Note. if you have irregular cycles you will mark this manually.
If you’re tracking ovulation, for example using basal body temperature or ovulation tests, you can manually mark the day(s) on which ovulation occurred and we’ll update the cycle. Just toggle ‘Ovulation confirmed’.
If you don’t menstruate, you can still track your cycle manually, by toggling “Start new cycle” whenever you feel a new cycle is beginning.
Setting up your cycle.
When you first activate the Period section you should see a button to set up your cycle.
If you ever need to change these settings you can open the ellipsis (…) menu at the top right of the Period section and press “Set up cycle”.
Do you menstruate?
If you usually menstruate mark this as yes.
You might not menstruate if you have had a hysterectomy if you are on some types of birth control, if you’re pregnant, or because a health condition prevents it.
If you don’t menstruate you’ll see the option to Track manual cycles, which lets you manually toggle when each new cycle starts. You can also use this to track hormonal cycles if you are a transgender man or woman.
Irregular cycle mode?
Many people have unpredictable cycles and estimates will not feel useful. Switching on irregular cycle mode will remove any estimates and let you mark manually.
Cycle length
Press the box to enter your cycle length. This is the time between one period starting and the next period starting. Often this will be between 21-35 days but it can vary depending on the person.
You can always amend this later, so if you don’t know your cycle length you can use a default value of 28 days. After a few cycles, you can view your average cycle length by pressing on the Cycles button.
Period length
This is how many days your menstrual bleeding usually lasts. You can mark which days your period actually happened using the ‘On period’ toggle when logging, so if this varies a lot you can either put in an average length or turn on irregular cycle mode.
When did your last period start?
Enter your last period start date if you know it. If not, you can leave this blank and just start your period when the next one occurs.
Do you ovulate?
Ovulation is the process of releasing an egg from an ovary. If you regularly ovulate, even if this does not happen every cycle, you can turn on this toggle to show a possible window for ovulation. This shows dates when ovulation might typically occur. If you’d rather not see this you can turn off ovulation and just track periods.
Please note, Bearable is not a fertility tracker and the ovulation window is only there to provide a helpful marker of the phases of your period, in order to better understand how those phases might impact your health.
If you do track ovulation you’ll see an option to Track ovulation manually. You might want to do this if you’re tracking your ovulation, for example using ovulation tests and want a more accurate estimate of when ovulation might have occurred. This will set the ovulation window to be the dates you confirmed manually (between the first and last day you mark each cycle).
How we calculate your cycle.
Unlike some other period trackers we don’t predict your future periods. We will show you estimated future dates simply based on your cycle length.
For example, if your cycle is 30 days and your last period began on 1st January, we will presume your next cycle to begin on the 31st January.
We will not presume the next cycle to have started until you manually confirm that this is the case by switching the “On period” toggle.
For the phases of your cycle, we will presume your period to last its typical length, unless you mark otherwise.
For the ovulation window, we will assume this to occur roughly 14 days before the expected end of your cycle. This is of course only an estimate and will not be the case for all users. There is an option to manually mark ovulation if you want to track this yourself.
We provide an ovulation window, which is an estimated range when ovulation might occur. Note, this is not the same as the “fertile window” you might see in other apps.
What are the phases of the cycle?
We split cycles into four phases. Not all users will have all phases, as it depends on your specific setup choices.
These phases are estimates and aimed to help understand the impact of different parts of your cycle on your health outcomes.
The period phase, if you have one, is the first day of menstrual bleeding until the last. Not all users menstruate and you can turn this off.
The follicular phase is the first stage of the menstrual cycle. We count this from the last day of your period until ovulation (if it occurs).
The ovulation window is a period of time in which an egg may be released from an ovary. This is just an estimate to help understand how different parts of the cycle may impact your health outcomes. It should not be relied on for tracking fertility. Not all users will ovulate and you can turn this off.
The luteal phase lasts from the end of the ovulation window until the start of your next period.
For insights, we also show Week before period, the seven days preceding your period.
Viewing your cycles.
You can view the stage of your cycle in the Period section. The diagram shows the current cycle and the phases.
Pressing on ‘Cycles’ to the right of the diagram will bring up your historical cycles, along with the average length and the variation.
You can also view this by pressing on the Ellipsis (…) at the top right of the Period tracking section and pressing ‘Cycles + Stats’.
Getting insights into your cycles.
We use the phases of the cycle as factors, so that you can correlate them with your health outcomes.
To see correlations go to the Impacts tab. At the top of the screen, where it says “How factors” press the word Factors to bring up the selection menu. You can now select Period factors.
This will show any custom period factors, alongside the phases of your cycle.
For example, if the Follicular phase is correlated with a +20% rise in symptoms, it means that your recorded symptom scores were 20% higher when you were in that phase of your cycle, compared to other phases of the cycle.
Remember, correlation does not imply causation. Treat these as potential impacts to be explored.
Creating and moving custom period factors.
You can create custom period factors. Press the ‘+’ icon at the bottom of the Period section.
Type a factor into the text box at the top and press ‘Confirm’
You can set binary factors (yes or no) or scale factors, like low, medium, and high.
You can also move factors to this section. If you type the name of an existing factor in this box it will give you the option you move it to this section.
Seeing your phases with the calendar.
The Period calendar will appear if you have the Period section active.
Go to the calendar by pressing the date at the top of the screen and then selecting the Period tab.
You can highlight other factors to help show when they typically occur with your period phases.
👋 Still have questions?
Let us know by contacting support@bearable.app and a member of the Bearable team can help you with anything you need.
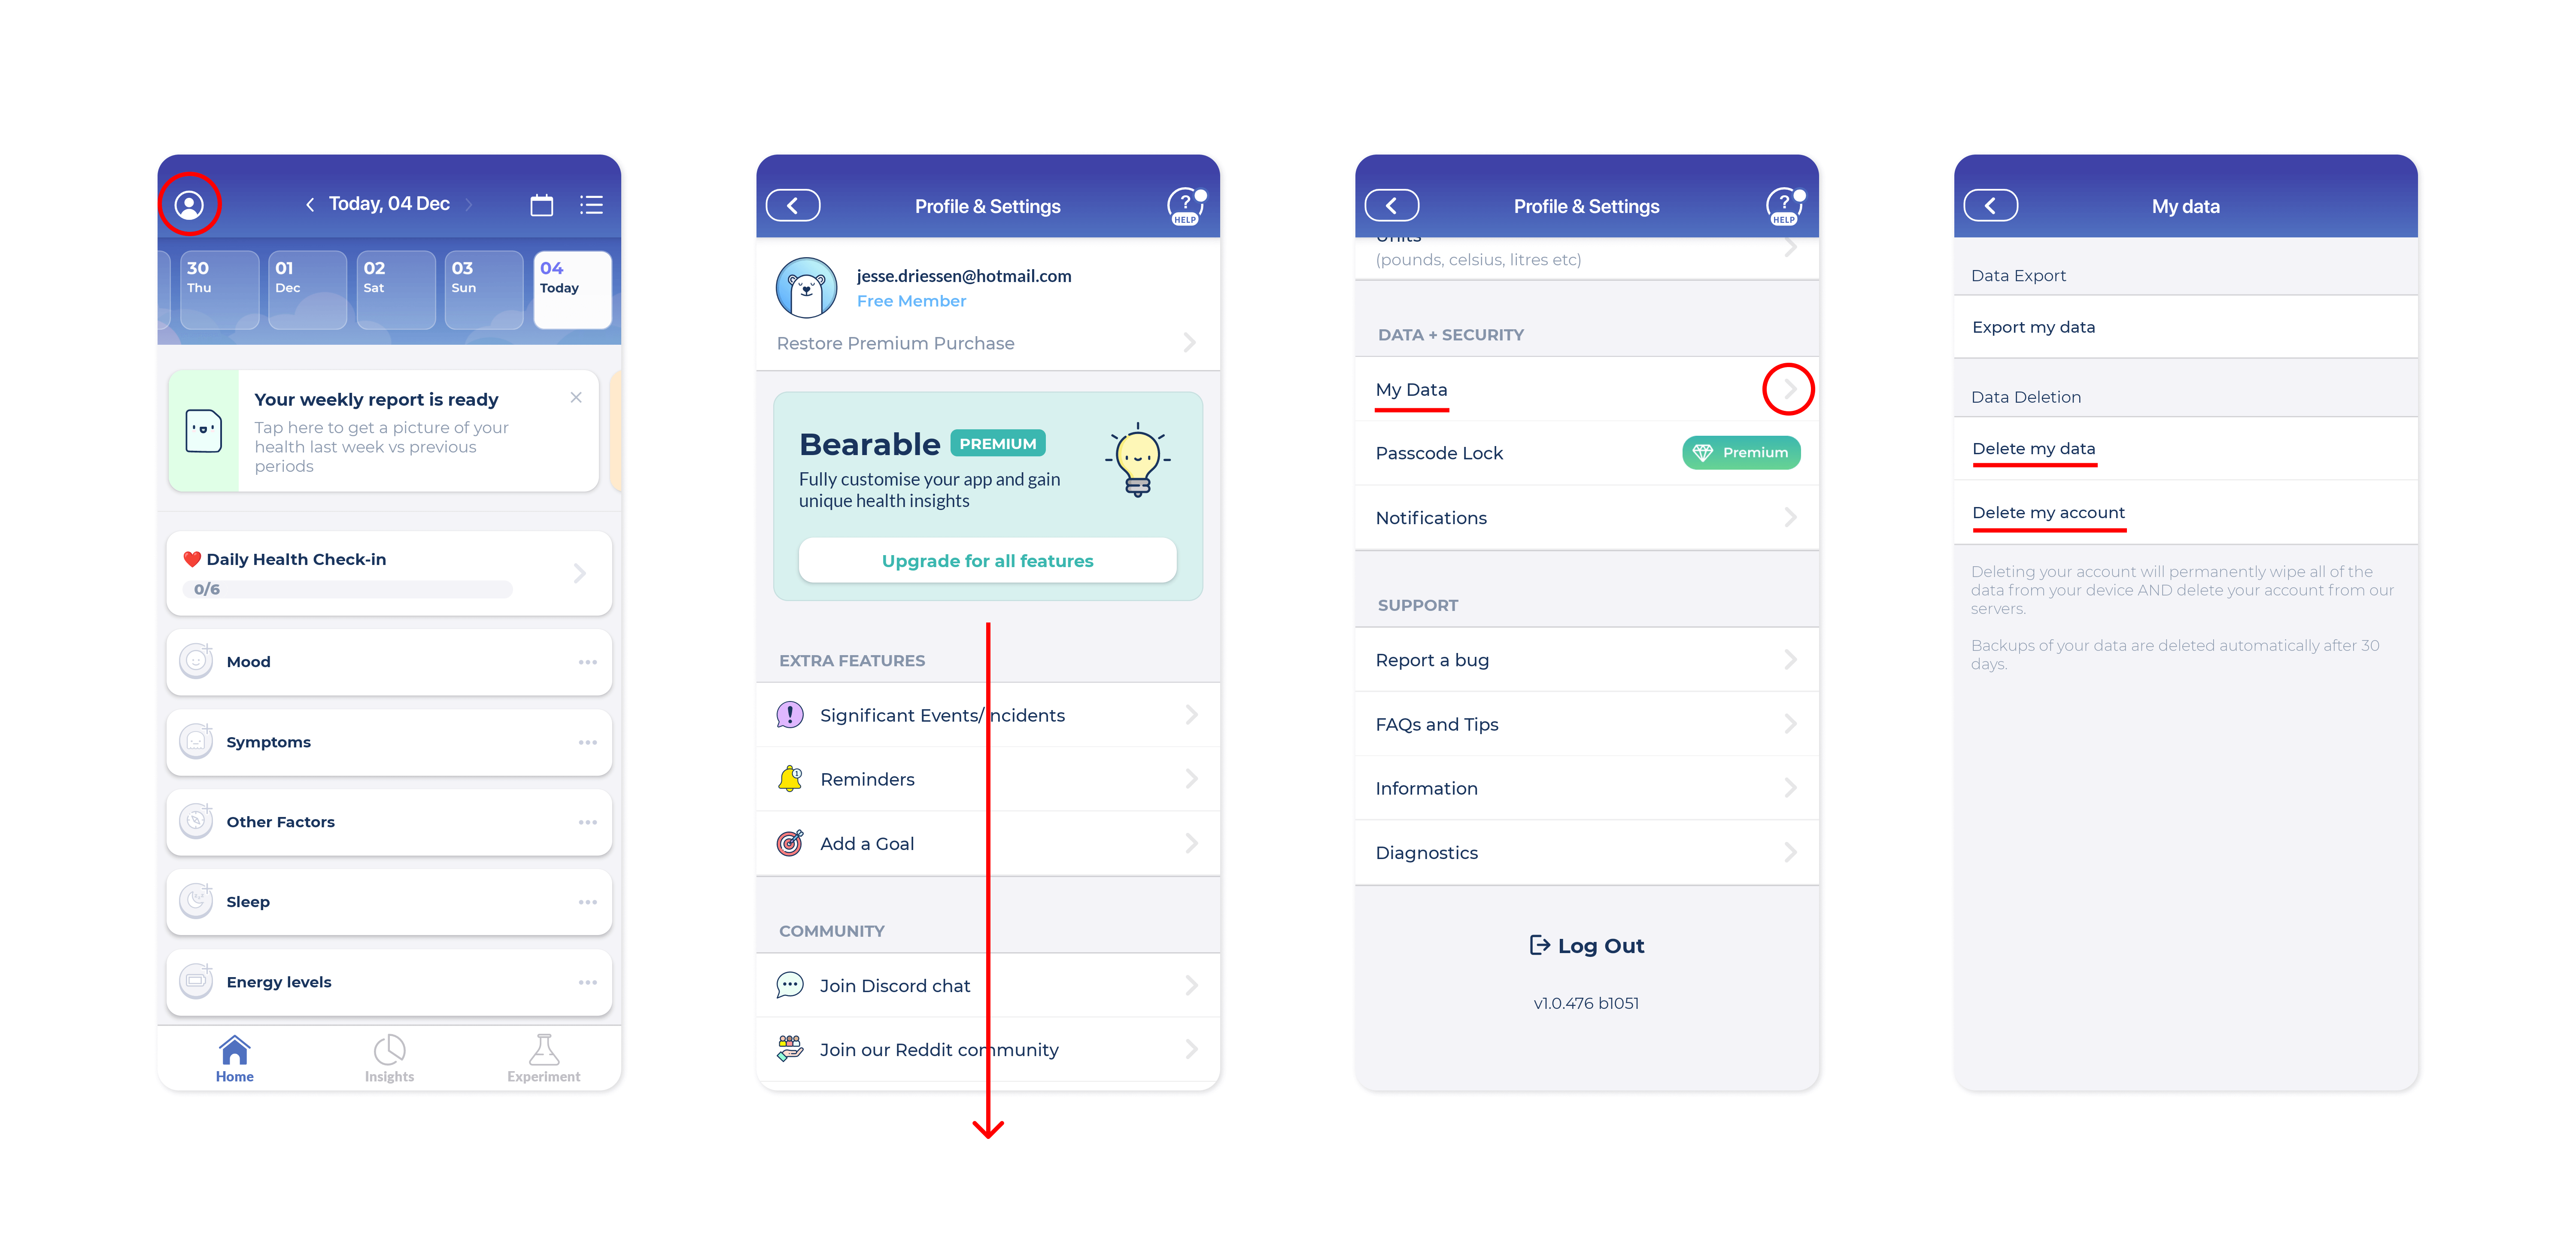
To give you complete control of your data at all times, we’ve made it possible for you to delete your account and/or data from within the Bearable app.
🗑️ To delete your account AND data.
For when you’ve decided to no longer use Bearable and don’t think you’ll return in the future.
Visit your profile & settings page by tapping the icon in the top left corner of the home screen.
Scroll down to the Data + Security section.
Then tap on the My Data menu item.
Click Delete My Account.
♻️ To delete your data but NOT your account
For when you want to start over but don’t want to sign up for a new account.
Visit your profile & settings page by tapping the icon in the top left corner of the home screen.
Scroll down to the Data + Security section.
Then tap on the My Data menu item.
Click Delete My Data.
Note.Once you delete your data we’ll no longer have a record of it, so make sure to export any of the data you think you might need in the future.
📬 To unsubscribe from our mailing list.
For when you want to unsubscribe from all Bearable emails.
Search your inbox for an email with the subject line Welcome to Bearable 👋
Scroll to the bottom of the email.
Click the unsubscribe button.
Note. If you can’t find this email, get in touch with us at support@bearable.app and we’ll manually remove you from our mailing list.
🆘 What to do if you no longer have access to your account.
If you can no longer sign in to your Bearable account please contact us at support@bearable.app so that we can delete your account and/or data for you.
A suspected health condition, illness, or disease. Create a custom symptom group and add the symptoms you’re experiencing using the Add/Edit button in the menu in the top right corner of the symptoms section on your home screen. You could also consider looking up the other symptoms of your suspected condition and tracking these too.
An unidentified condition, illness, or disease. Create a custom symptom group and add the symptoms that you’ve been experiencing using the Add/Edit button in the menu in the top right corner of the symptoms section on your home screen.
An existing condition. Create a symptom group for your existing health condition and decide what’s most important to track before adding these symptoms to the group. Because tracking all your symptoms can become overwhelming, it can help to just focus on the symptoms that cause you the most problems.
Note. You can also use and edit existing symptom groups with the Add/Edit button at the bottom of the symptoms section on your home screen.
To communicate with a medical professional.
Make a point of tracking your most concerning health issues in the Symptom, Mood, Sleep, Energy Levels, or Custom Ratings sections on your home screen. Add notes to your mood and symptom entries (or using the notes section) so as to remind yourself of questions or observations that you want to share with your doctor or medical team at your next appointment.
Note. Doctors will often want to know your priorities, concerns, existing treatments, medications, medical history, and changes in your weight, appetite, energy levels or sleep.
To learn what’s negatively impacting your health.
If there’s something about your health that’s being impacted negatively and you’re not sure why (i.e. your sleep has gotten worse in the past month) you just need to track the health outcome that’s being impacted (e.g. sleep) in the relevant section and the suspected causes (e.g. caffeine, alcohol, sources of stress, etc.) in the Factors section on your homepage. If you’re not sure what the common triggers are, a quick Google search can help provided you use a credible source that has been verified by a medical professional (such as Healthline.com).
To learn how to improve your health.
If there’s something you’d like to improve about your health but you’re not sure where to begin, you just need to track the health outcome that you’d like to improve in the relevant section on your homepage as well as the new habit you’re hoping will help in the Factors section. Premium subscribers can also discover the impact of a new habit using a custom experiment in the experiments tab. If you’re not sure what might help, a quick Google search can help provided you use a credible source that has been verified by a medical professional (such as Healthline.com).
To stay accountable for your health.
Track your existing habits in the factors section (using the add/edit button in the menu in the top right corner of the factor section) and use it as a daily reminder or checklist that includes all of the things that help (and don’t help) you to manage your health. You might also benefit from setting reminders for some of these habits from your profile page.
Note. To test the impact of a new habit, you can use the experiments feature to determine if it has a significant impact on your health before adding it to your routine.
Something else?
Let us know by getting in touch with support@bearable.app and we can help you to get set up.
Some members of the Bearable community want to identify triggers, effective self-management strategies, or helpful new habits to help them to better manage their health. If this is you, it can be useful to think about tracking these things one at a time, over shorter periods of time (e.g. 7 to 30 days). This way, you can determine the impact of one thing on your health before moving on to testing something new, as opposed to trying to track everything all at once.
✅ What you should track.
Make a decision about what aspect of health your want to learn more about. This could be a specific Symptom, your Mood, Sleep, or Energy levels.
Once you’ve made a decision about the main aspect of your health that you’d like to learn more about, use the Add/Edit button in the navigation menu in the top right corner of each section on your homepage to track that metric (if it’s not already visible on your home screen).
Next, you want to determine the things that might be impacting your chosen metric. If you’re not sure where to begin, you can track some common factors such as caffeine, alcohol, hydration, sugar, level of physical activity, time spent outdoors, time spent looking at screens, time on social media, time spent socialising.
Once you have a shortlist of things you think might be impacting your health, you can add them to your Factors section using the Add/Edit button in the navigation menu in the top right hand corner of the Factor section on your home screen.
Another useful metric to track that can have a big impact on your health is Sleep, so it can also be helpful to also track this alongside any other health metric you’d like to learn more about.
Now you can begin to track your health metrics daily, and the things impacting your health as they occur throughout the week. After 7 to 14 days you should begin to see some results. Note. To track the impact of a factor on a Custom rating (e.g. Productivity, Concentration, Work-life balance), Health measurement (e.g. Steps, Blood pressure, HRV, etc.), or to track the impact of a specific element of your diet or nutrition, create a custom experiment instead.
💡 How to use your data to discover what improves and worsens your health.
Once you’ve collected 6 days of health metric data and also have three days with and three days without any of your factors, you’ll be able to begin to see correlations between them.
Visit the Insights page and then the advanced report for your selected health metric. For Symptoms, scroll to the Prevalence section and tap the relevant symptom to be taken to an advanced report.
Within each advanced report is a section titled Effect on and this shows you the correlation between each factor and your chosen health metric.
You can also use the Correlations section at the top of the insights page to view the impact of multiple factors on multiple health metrics.
Or, on the insights page, rotate your phone 90 degrees to manually identify trends and correlations between health metrics (buttons under the graph) and factors (button in the top-right corner).
🧪 How to use experiments to simplify this process.
Our custom experiments tool on the Experiments page makes it especially easy to determine the correlation between one Factor and one health metric. This can remove a lot of the complexity of tracking multiple factors at once and is especially useful for understanding the impact of a new habit or lifestyle change on your health.
Visit the experiments page, scroll down to createcustom experiment, and complete the set-up process.
Then, complete the experiment on as many days as possible for your selected duration.
At the end of the experiment period, you’ll be shown a breakdown of how the factor correlated with positive and negative changes in your chosen health metrics.
Many members of the Bearable community use the app to help them to communicate with a GP, members of their medical team, or their therapist. If this is you, it can be helpful to focus on tracking what’s going to be most useful for your next appointment rather than attempting to track every aspect of your health and lifestyle.
🏥 A doctor or member of your medical team is likely to want to know:
What you’re most concerned about.
What has changed since you last saw them or another Doctor.
How often the problem occurs.
How the problem is affecting your ability to function day-to-day.
The impact of any treatments, medications, or changes in lifestyle.
The symptoms that you’d like to discuss with your doctor, using the Symptoms section on your homepage.
The impact of your health on your ability to work, socialise, and complete everyday tasks, by tracking days when you were unable to do these things in the Factors section.
Questions you have for your doctor using the Extra Notes section, or note-taking options in theSymptom andMood sections.
Each time you visit the doctor in the Significant Events page on your Profile.
Any treatments or lifestyle changes as Factors.
Any medications in the Medication/Supplements section.
To add new symptoms and factors to track on your homepage, click the add/edit button in the navigation menu in the top right corner of the symptoms section on your home screen. If you can’t find one of the sections mentioned above, use the edit button at the bottom of your homepage to toggle the visibility of sections.
Note. you don’t necessarily need to track every symptom for every one of your conditions and can instead just focus on the ‘priority’ symptoms that you feel you have the least understanding or control over. Over time, you can add, remove, and update the symptoms and conditions that you track.
💡 Reports that might be useful for medical appointments …
Advanced symptom reports accessed via the Prevalence section on the Insights page, will show you changes in severity levels, average severity levels, and the impact of a factor on each symptom.
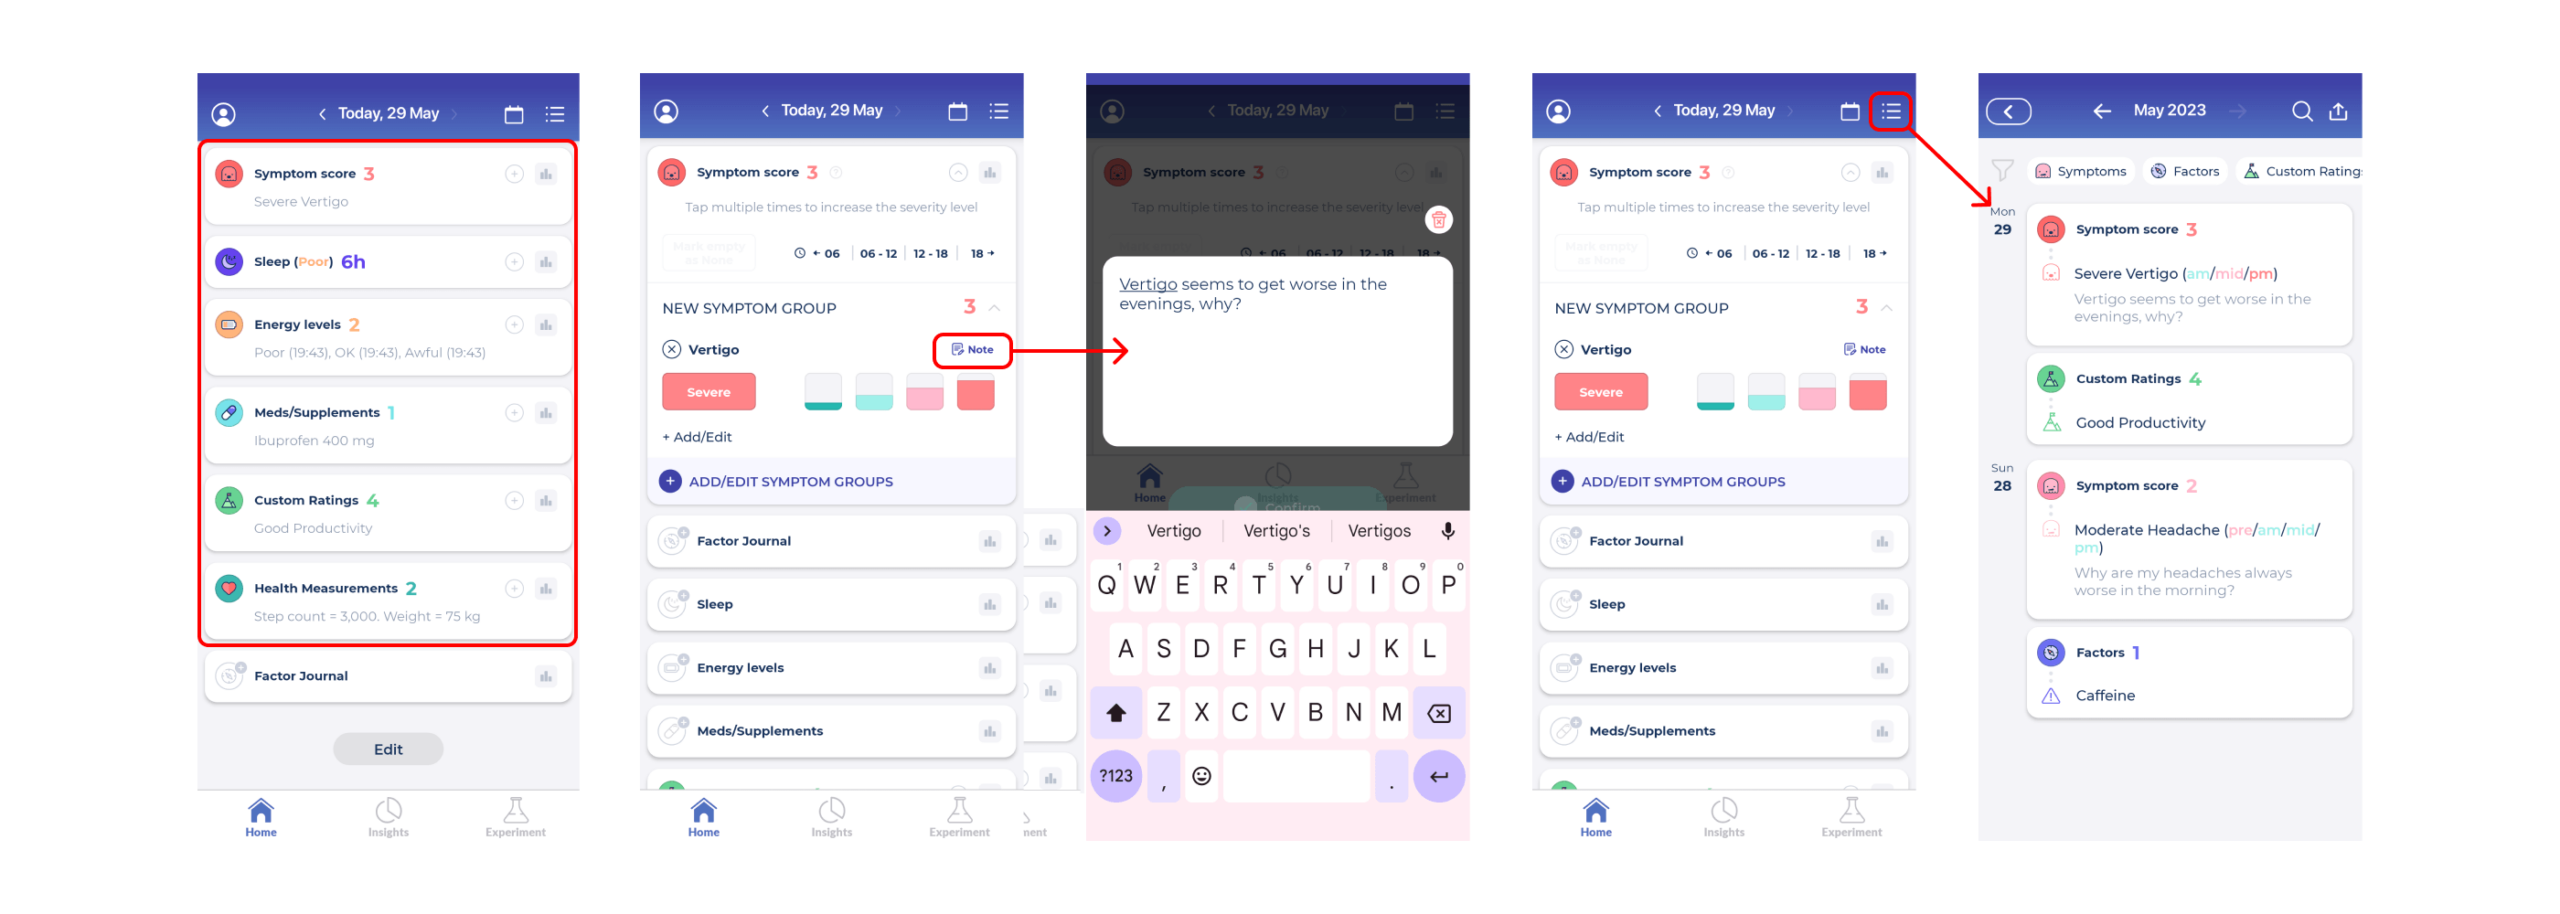
The Timeline & Calendar reports accessed via the icons in the top right-hand corner of your homepage, will help you to identify specific dates when changes in your health occurred as well as a summary of your notes, symptoms, and treatments by date.
Advanced factor reports under the Factor Count section on the insights page, will help you to quantify the frequency of different habits, lifestyle changes, etc. and their correlation with your symptoms.
The comparison graph which can be accessed by visiting the insights page and rotating your phone 90 degrees, can help you to manually seek trends and correlations.

")