How Can We Help?
Track “bad” habits like cigarettes and alcohol (by quantity and frequency)
At Bearable we’re big fans of helping people to find what habits work best for their health and that’s going to be different from person to person.
Keeping track of “bad” habits like caffeine, sugar, alcohol, tobacco, etc. Is a great way to understand how each of these things impacts your mood, sleep, energy, and symptoms.
To get a good understanding of the effect they have it’s important to track how often the habits occur (frequency) as well as how much you consume (quantity).
This will give you better quality insights that help you to find the right balance for you.
📈 Tracking “bad” habits by quantity and frequency:
There are two main ways to do this:
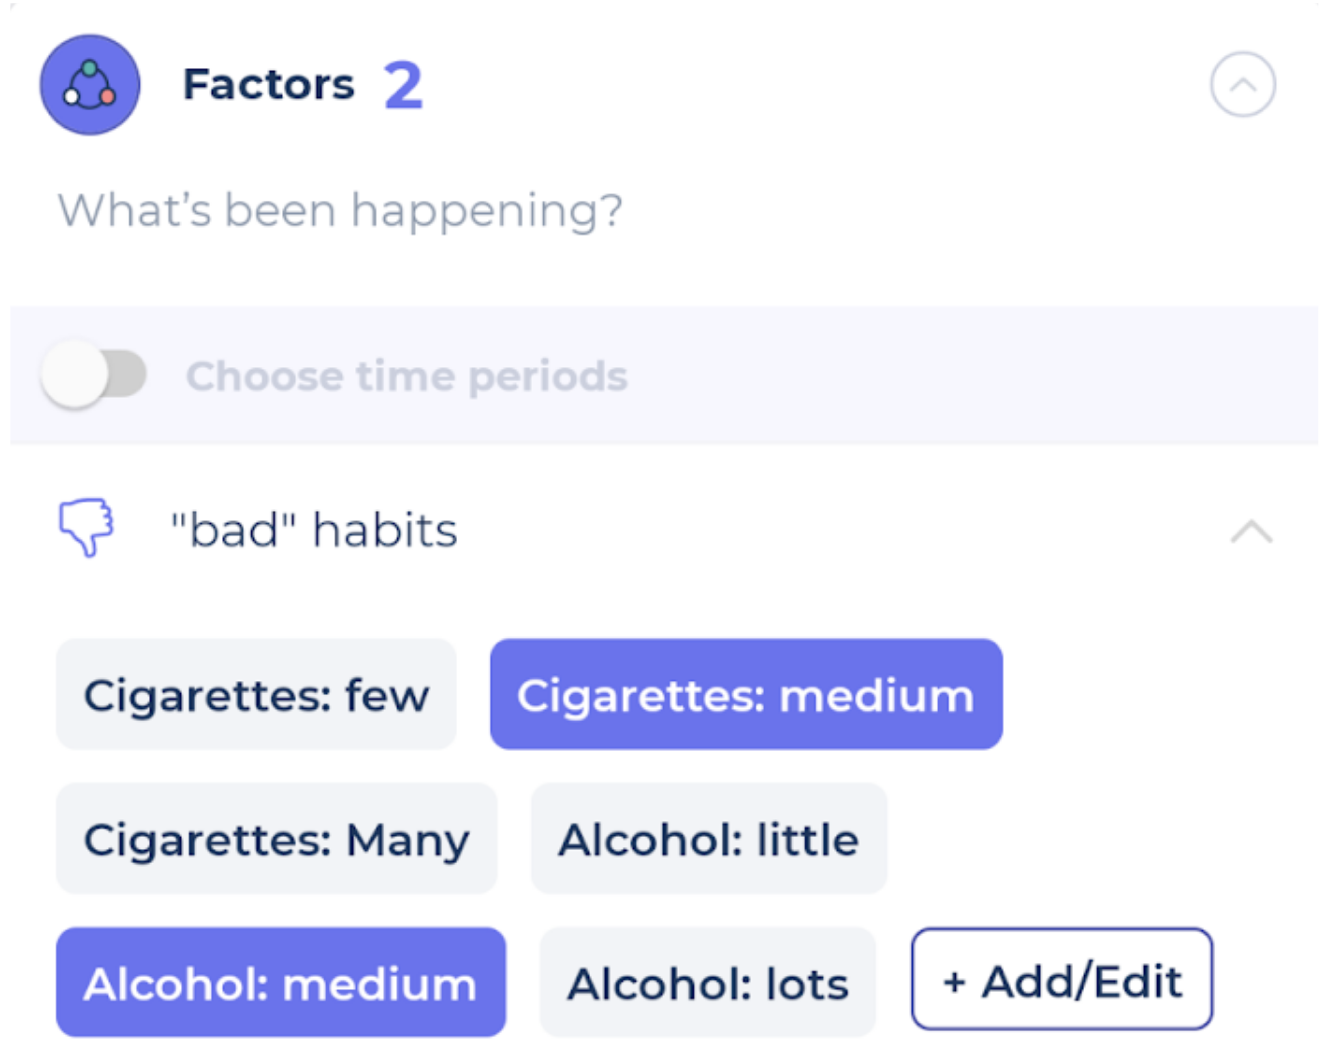
One: Tracking habits as factors.
The easiest way to track a “bad” habit is to create a custom factor group called something like “bad habits”. You’ll then be able to add customer factors to that group that track a range of behaviours e.g.
-
-
- Drank Alcohol: Lots
- Drank Alcohol: Moderate
- Drank Alcohol: Little
-
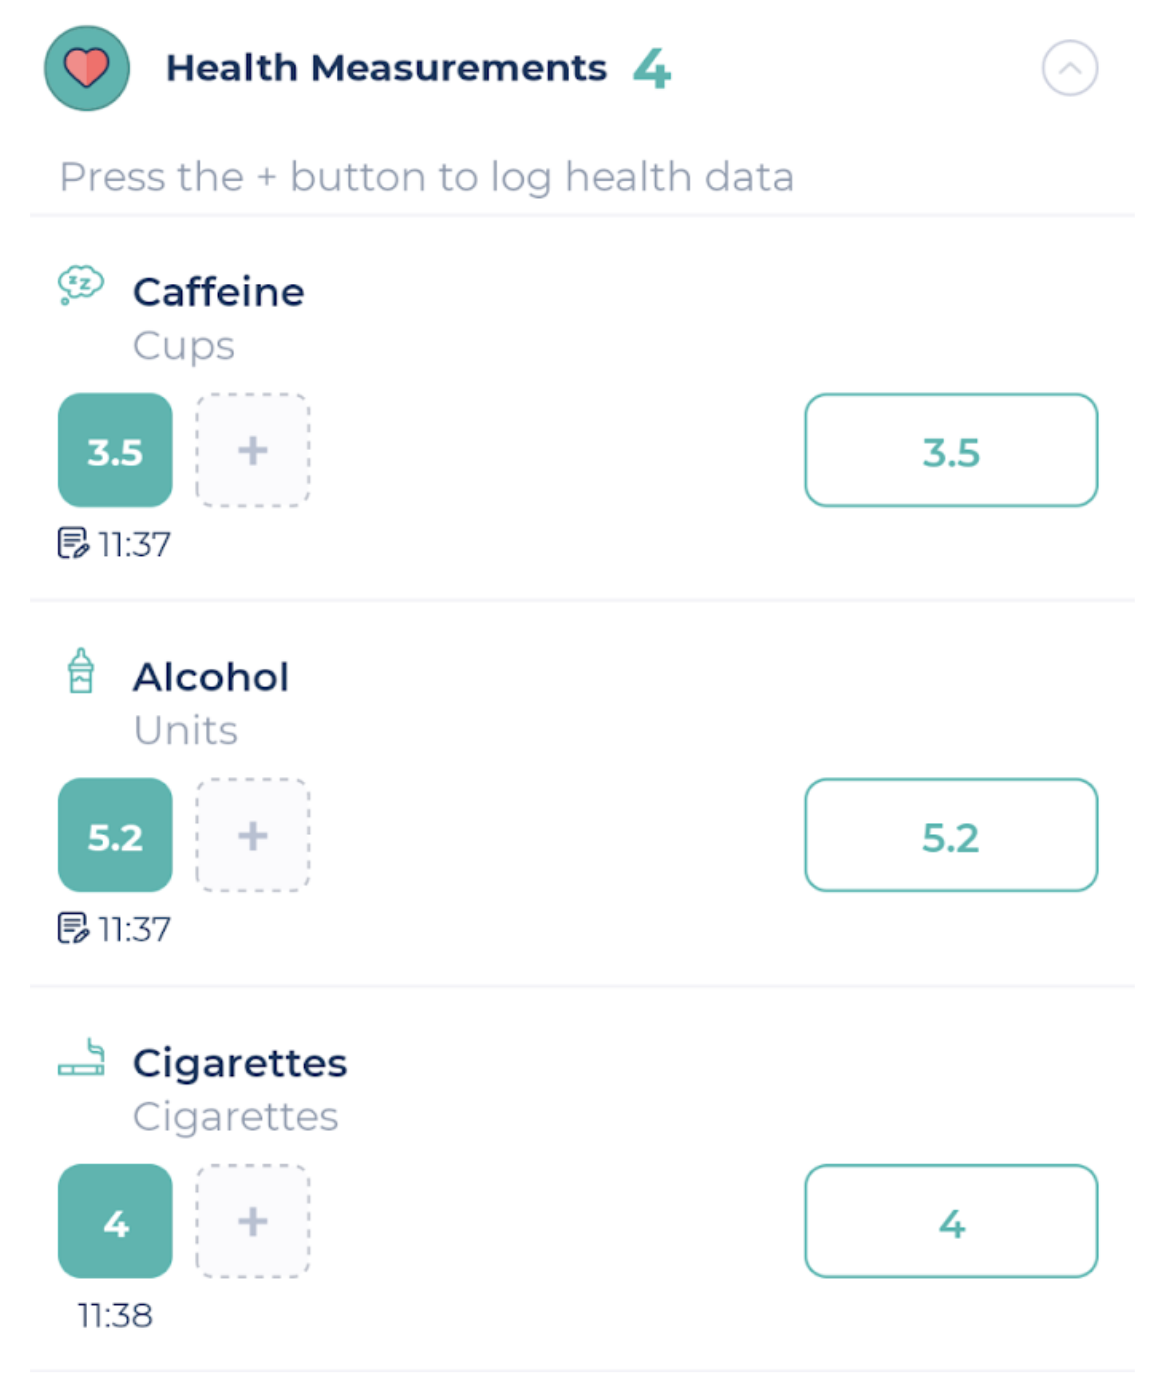
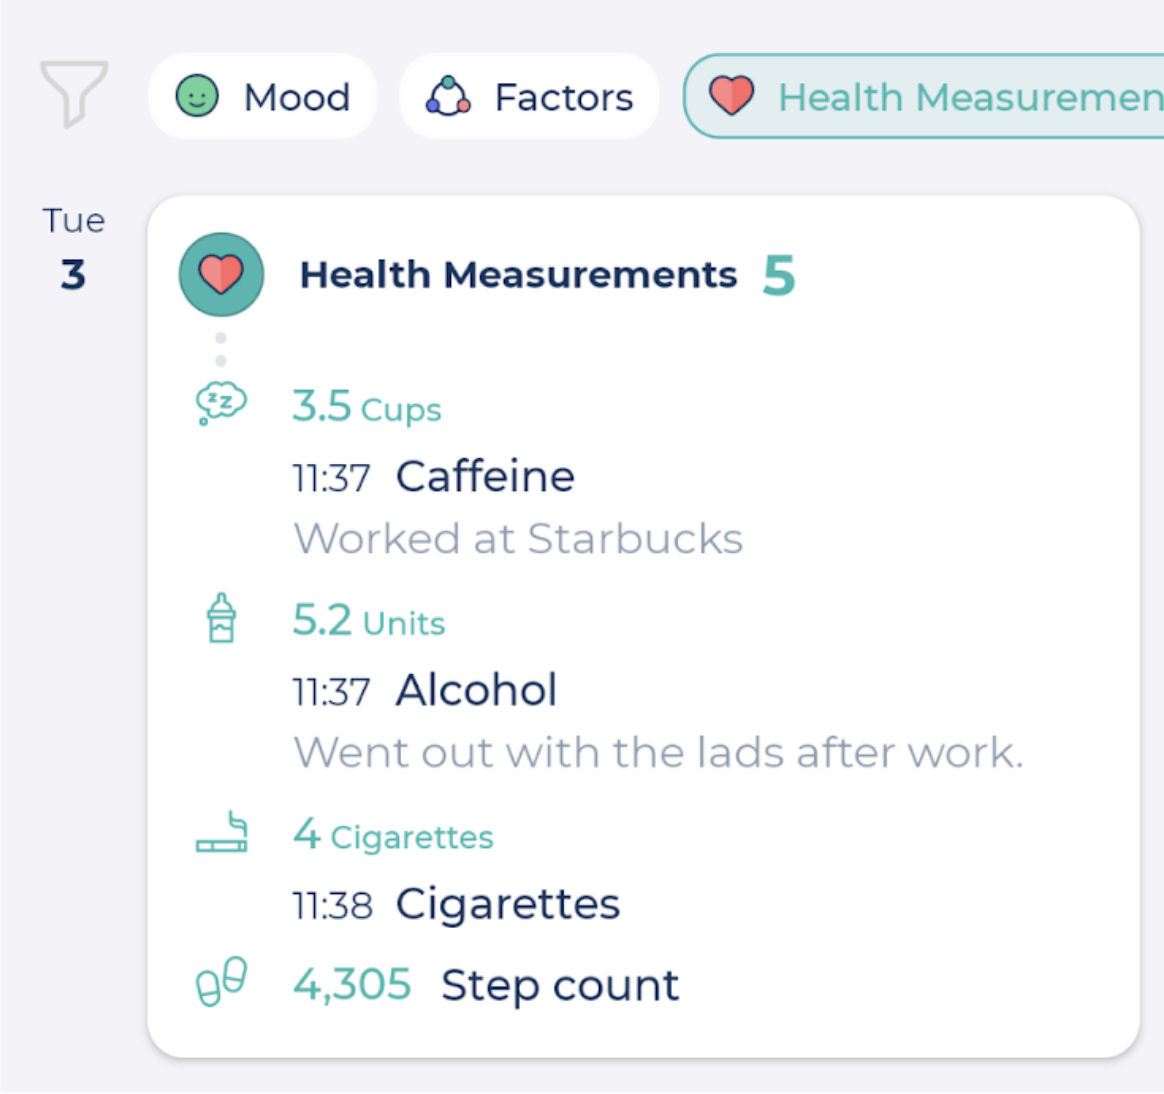
Two: Tracking habits as Health Measurements.
The more detailed way to track a “bad” habit is using the Health Measurements section (add it to your homepage using the Edit button at the bottom of your homepage). You can create a custom measurement by clicking “add/edit” in the menu in the top right corner of the Health Measurements section and then clicking “Create Custom Measurement” on the next screen. This will allow you to more specifically track your habit by units, millilitres, grams, etc. For example:
-
-
- The number of units OR number of bottles of alcohol that you drank
- The weight of tobacco OR number of cigarettes you smoked
- The amount of coffee in ml OR the number of cups you drank
-
🔎 Where can you view the effect of these habits on your health?
There are a few different ways to view how your habits correlate with your health outcomes. The main ways include:
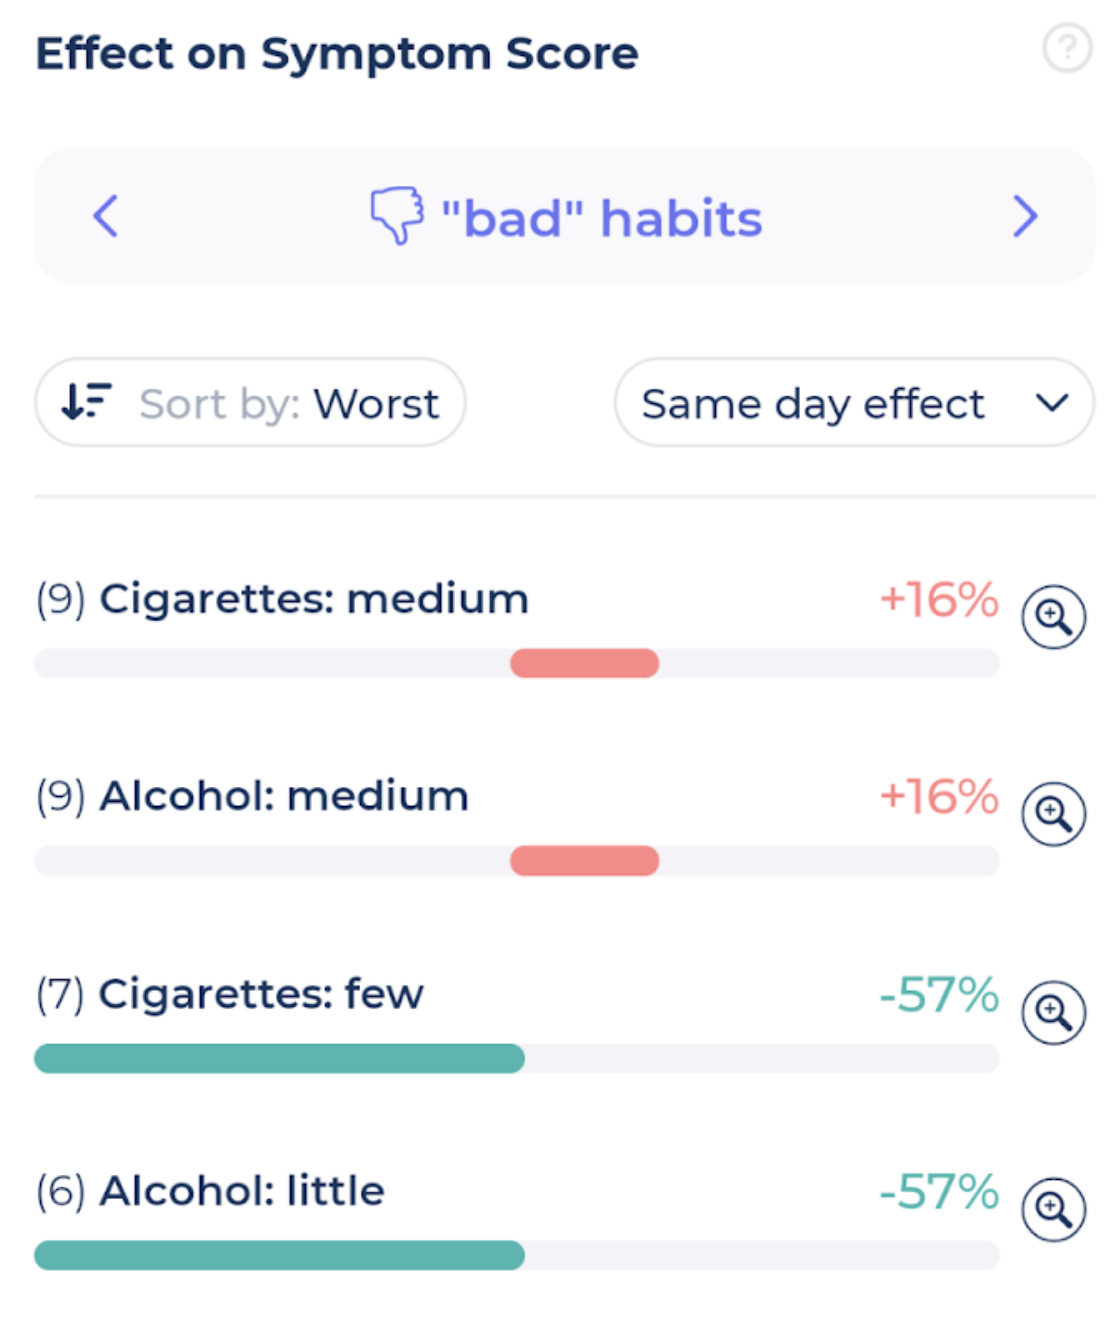
The Factor Effect Report
If you have a Premium Subscription you can click into ANY of the advanced insights reports for mood, symptoms, sleep, and energy. Then scroll down to the factor effect on report and click the arrows at the top of the section to view the “bad habits” factors. You’ll be shown the percentage change in your health outcomes that correlate with your “bad habits”.
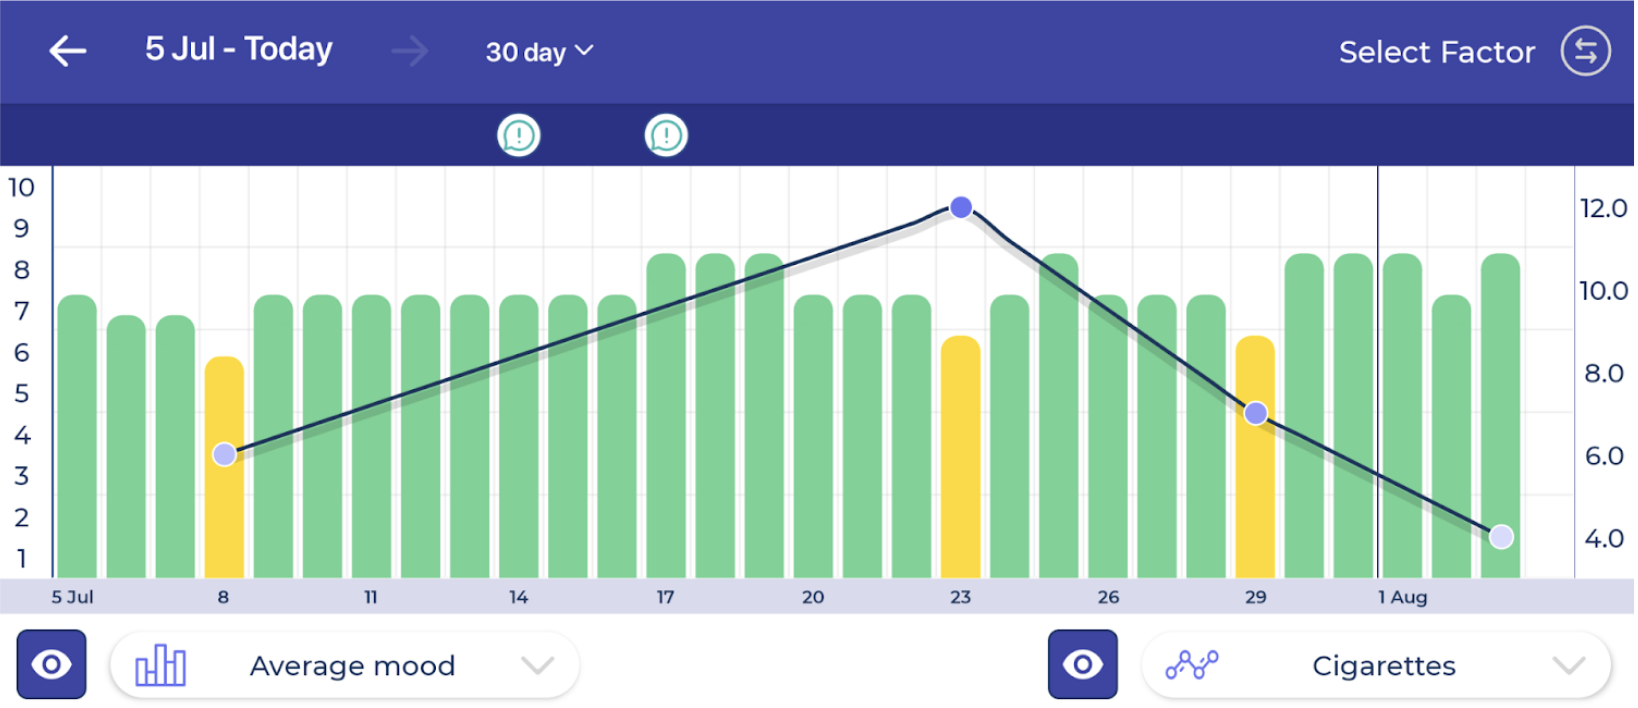
The Comparison Graph
If you use Bearable for free, you can look for correlations between factors and health outcomes using the comparison graph. To access this, go to the Insights tab, wait for the screen to load, and then rotate your phone by 90 degrees. A new chart will appear where you can plot and compare:
-
- Health measurements using the buttons below the chart
- Mood, Energy, Sleep, and Symptoms using the buttons below the chart
- Factors such as “Drank Alcohol: Lots” using the button in the top right of the screen
On Your Timeline
You can also view your factors and health measurements (and any notes you take relating to them) by using the timeline report on your homepage. Just click the timeline icon in the top right-hand corner of the app and sort the list using the buttons at the top of the timeline.
✋ Looking For More Info?
-
- Check out our support blog for more content like this.
- Chat with other Bearable users on our Subreddit and on our discord server
- Take a look at our blog to see how Jesse learns about his health with Bearable.